Bench Degree·CYMATICSchapter
Chapter 16: The Ear Is a Resonator Bank
Inside each of your ears is a coiled strip of tissue about as long as your thumbnail is wide, and it does to sound what a prism does to light.
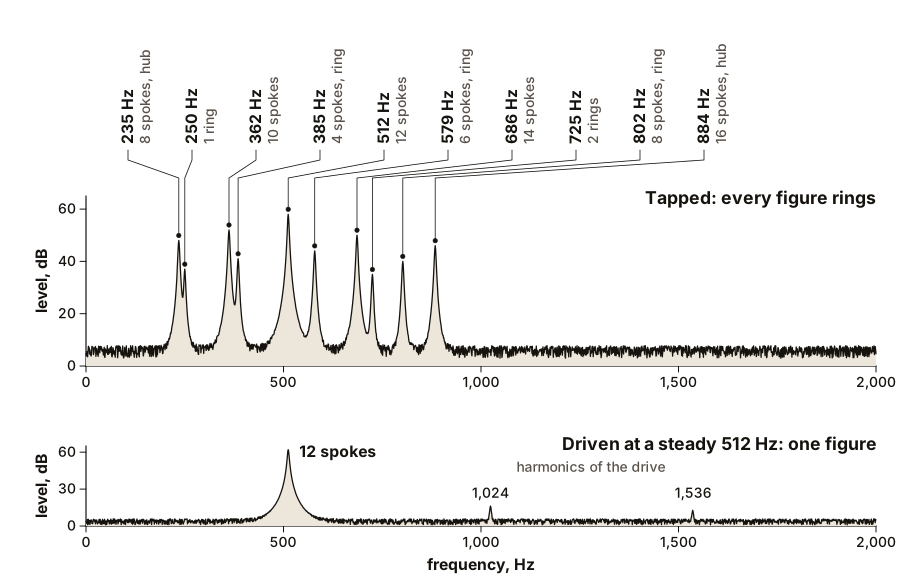
Put a free spectrum analyser app on your phone. Lay the phone on the bench beside the chapter 1 plate, salt brushed off and the amplifier off. Now tap the edge of the plate with a fingernail, the way you did on the first night to hear it ring.
The screen shows a row of thin spikes standing up from a floor of noise, and they die away one by one. Freeze the display and read them off. There is one near 235 Hz, another near 250, one near 362, one near 385, a tall one near 512, and more above. They are the frequencies in the table in Chapter 1. One tap set every figure on the plate ringing at once, and the app has separated them.
You heard the tap as one sound, a metallic ting, but its character came from that set of spikes; a wine glass or a saucepan has its own row. Your ear takes every sound apart into its frequencies before your brain hears anything, and it does it with a row of resonators of the kind Part II built. This chapter follows a sound from the air to that row.
Section 1: A Spectrum
A list of which frequencies are present in a sound, and how strong each one is, is called its spectrum. The word comes from Newton’s prism, which spread sunlight into a band of colours. The analyser’s picture has frequency along the bottom and level, usually in decibels, up the side.
The idea that any sound can be split this way has a precise form. In 1822 the French mathematician Joseph Fourier published Théorie analytique de la chaleur, a book about the flow of heat, and in it he showed that a repeating wave of almost any shape can be built by adding together sine waves: one at the repeat rate of the shape, and others at two, three, four and more times that rate, each with its own strength. Any repeating shape, however jagged, is a stack of smooth sine waves at whole-number multiples of one frequency. That stack is its spectrum, and finding it is called Fourier analysis.
IN PLAIN ENGLISH: Any sound that repeats can be made by mixing pure tones together, one at its own pitch and others at two, three, four times that pitch, each at its own loudness. A spectrum is the recipe: which tones, and how much of each. A spectrum analyser reads the recipe off a sound.
The plate’s tap is different, and the difference teaches a lot. Its spikes are at 235, 362, 512, 686 Hz: not 1, 2, 3, 4 times anything. A struck plate rings at its own natural frequencies, and for a plate those are not whole-number multiples. That is why a plate, a bell or a cymbal sounds clangy and a string or a voice sounds like a note. A note is a spectrum whose spikes line up in whole numbers.
ON THE BENCH: Three spectra
Parts: your phone with a free spectrum analyser app, one showing a live graph of level against frequency; your voice; the chapter 1 plate. Cost: nothing. Time: 20 minutes. Hazards: none. Method: set the app’s frequency axis to run from 0 to about 4,000 Hz. First, hum a steady low note, lips closed, 20 cm (8 in) from the phone. Freeze the display and read off the spikes. Second, whistle a steady note and freeze it. Third, tap the edge of the plate and freeze the display about half a second after the tap. Write down every spike you can read in each. What you should see: the hum is a comb: a spike at your humming pitch, perhaps 100 to 200 Hz, and a row of smaller ones at exactly two, three, four and more times it. Divide each by the lowest and you get whole numbers. The whistle is almost a single spike, somewhere between 1,000 and 3,000 Hz, with very little else: it is about as close to a pure sine wave as a human can make. The plate gives an uneven row at the frequencies in Chapter 1’s table, and their ratios are not whole numbers. If it does not work: if the hum shows only one or two spikes, hum louder and with a more nasal, buzzy tone; the upper harmonics are there but quiet. If the plate shows a blur, the app is averaging over too long a time; look for a setting called resolution or FFT size and set it larger, which sharpens the spikes and slows the update. Better, if you have one: drive the plate with a steady 512 Hz sine and look again. You get one tall spike and small ones at 1,024 and 1,536 Hz. Those small ones are not plate figures. They are the speaker and the rattling salt bending the sine slightly, and a bent sine has harmonics, exactly as Fourier says it must.
Section 2: Air to Bone to Water
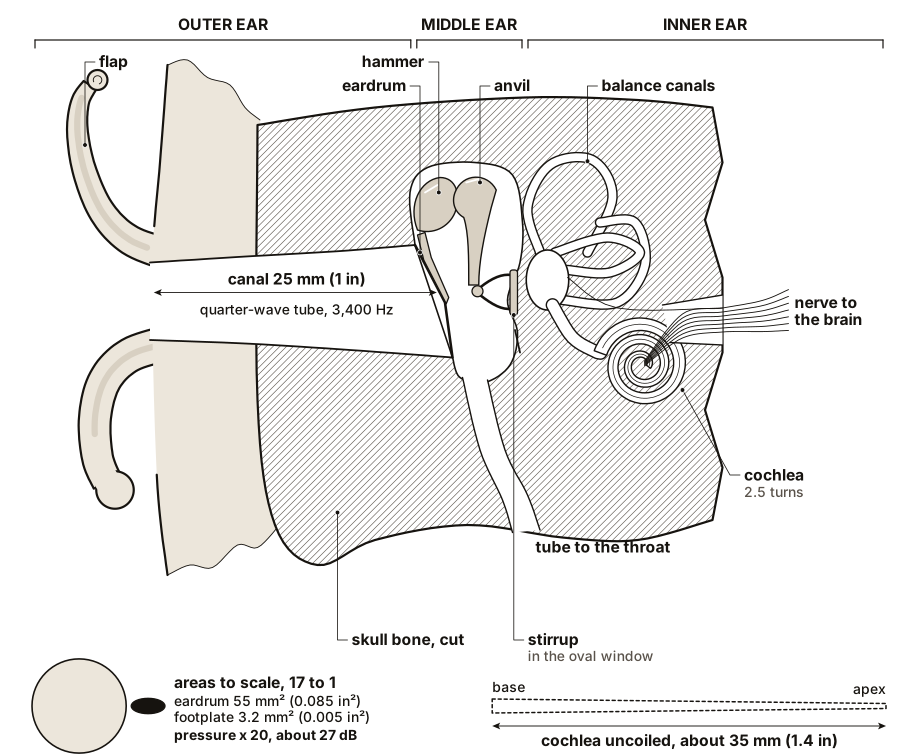
The outer ear is the flap you can see and the canal behind it, about 25 mm (1 in) long and closed at the inner end by the eardrum. A tube closed at one end is a resonator. Its lowest natural frequency is the one whose quarter wavelength fits the tube, which for 25 mm (1 in) is about 3,400 Hz. So the canal boosts sound in the range 2,000 to 5,000 Hz, by something like 10 to 20 dB at its peak once the outer flap is included; published figures vary with the ear and the method. The first thing your ear does to a sound is change its spectrum, turning up the band where the consonants of speech live.
The eardrum is a thin cone of skin, and behind it is the middle ear: an air-filled space bridged by three tiny bones, the hammer, the anvil and the stirrup. The stirrup is the smallest bone in your body, about 3 mm (0.12 in) long. Its footplate sits in a window in the wall of the inner ear, which is full of fluid.
The bones solve a problem. Air is light and easily squeezed; water is dense and stiff. A sound wave in air hitting water mostly bounces off: only about a thousandth of its energy gets in, a loss of about 30 dB.
The middle ear is a matching device. The eardrum’s working area is usually given as about 55 square millimetres (0.085 square inches), and the stirrup’s footplate is about 3.2 square millimetres (0.005 square inches), seventeen times smaller. The same force spread over a seventeenth of the area makes seventeen times the pressure. The bones add a small lever, about another third. On paper the result is a pressure gain of about twenty, roughly 27 dB, which wins back most of what the air-to-water boundary would lose. Measured gains come out lower, nearer 20 dB, and textbooks quote area ratios anywhere from 14 to 20. These are averages; ears vary.
Section 3: The Cochlea Unrolled
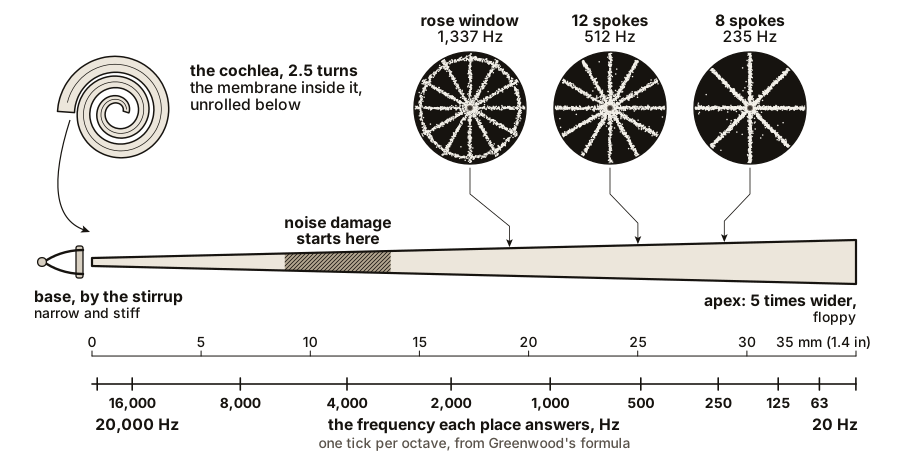
The inner ear is the cochlea, from the Latin for snail: a coiled tube about two and a half turns round, the size of a pea, bored into the hardest bone in the skull. Uncoiled it would be about 35 mm (1.4 in) long. Down its length, dividing it into an upper and a lower channel, runs a strip of tissue called the basilar membrane.
The membrane is the whole trick, and its trick is that it changes along its length. At the end nearest the stirrup, the base, it is narrow, about 0.1 mm (0.004 in), and stiff. At the far end, the apex, it is about five times wider and far floppier. Chapter 3 showed what that does. A stiff, light thing has a high natural frequency; a floppy, heavier thing has a low one. So every point along the membrane has its own natural frequency, from about 20,000 Hz at the base down to about 20 Hz at the apex, in a smooth sweep.
When a pure tone enters, the patch of membrane whose natural frequency matches it moves most, and the patches either side move less. That is resonance, exactly as Chapter 9 measured it on the plate. Along the membrane sit about 3,500 inner hair cells, each with a tuft of fine bristles that bends as its patch moves, and each wired to nerve fibres. Each one reports how hard its own patch is moving. The ear does not send the brain a sound. It sends a map: which places along the membrane are moving, and how much. Place stands for frequency, so the map is a spectrum.
The map is not even. In 1990 the auditory physiologist Donald Greenwood fitted a formula to measurements across many species that gives the frequency at each point (Journal of the Acoustical Society of America 87, 1990). Above about 500 Hz, every doubling of frequency takes about the same length of membrane, roughly 3.5 to 5 mm (0.14 to 0.2 in). From 250 to 500 Hz is about as far along as 2,000 to 4,000 Hz. The membrane is laid out in ratios, the same way the ear judges loudness in ratios in Chapter 15.
Section 4: Helmholtz’s Piano and Békésy’s Wave
The idea that the inner ear is a row of tuned resonators is old, and it was first put precisely by the German physicist and physician Hermann von Helmholtz in 1863, in Die Lehre von den Tonempfindungen (On the Sensations of Tone, in Alexander Ellis’s English translation of 1875). Helmholtz proposed that fibres stretched across the basilar membrane, short at one end and long at the other, worked like the strings of a piano, each tuned to its own pitch and each set swinging by the part of a sound that matched it.
He made the point with a piano. Lift the dampers off the strings by holding down the right-hand pedal, and sing a vowel loudly into the instrument. Then stop. The piano sings your vowel back, faintly but recognisably. Each string has answered the component of your voice that matched its own frequency, and together they rebuilt the spectrum. A row of resonators, each picking out its own frequency, is a machine that performs Fourier analysis, and Helmholtz argued the cochlea was one.
ON THE BENCH: Helmholtz’s piano
Parts: an acoustic piano, upright or grand; or a guitar, tuned normally, lying flat. Cost: nothing, if you can get at either. Time: 5 minutes. Hazards: none. Method: hold the right pedal down, so every string is free. Put your face near the strings, or over the soundboard of an upright with the lid open, and sing one vowel, loud and steady, for two seconds: ah. Stop abruptly and listen, keeping the pedal down. Try ee, then oo, on the same pitch. With a guitar, sing a note that matches one of the open strings into the sound hole and stop. What you should see: the piano answers each vowel with a ghost of that same vowel. Ah and ee come back sounding different from each other, though you sang them on one pitch, because the strings that answer are different. The guitar answers only when your note, or one of its harmonics, matches a string or one of the string’s harmonics. If it does not work: sing louder and closer, and stop sharply; a trailing breath covers the echo.
Helmholtz’s picture was right in its outline: place along the membrane stands for frequency. It was wrong in its mechanism, and it took the Hungarian physicist Georg von Békésy most of three decades to show how. Working at the Hungarian telephone research laboratory in Budapest from the late 1920s, and later at Harvard, Békésy opened cochleas from human cadavers, sprinkled the membrane with fine reflecting particles, and watched it under a microscope with a flashing light while he drove it with tones.
What he saw was not a set of separate strings each swinging alone. He saw a wave. Each tone launched a ripple at the base that ran along the membrane towards the apex, growing as it went, reaching a peak at one place and then dying away quickly beyond it. Low tones ran far before peaking; high tones peaked near the base. The membrane’s pieces are coupled to each other through the fluid, and the resonance shows up as the place where a travelling wave piles up and stops. Békésy collected the work in Experiments in Hearing (1960) and received the Nobel Prize in Physiology or Medicine in 1961 “for his discoveries of the physical mechanism of stimulation within the cochlea.”
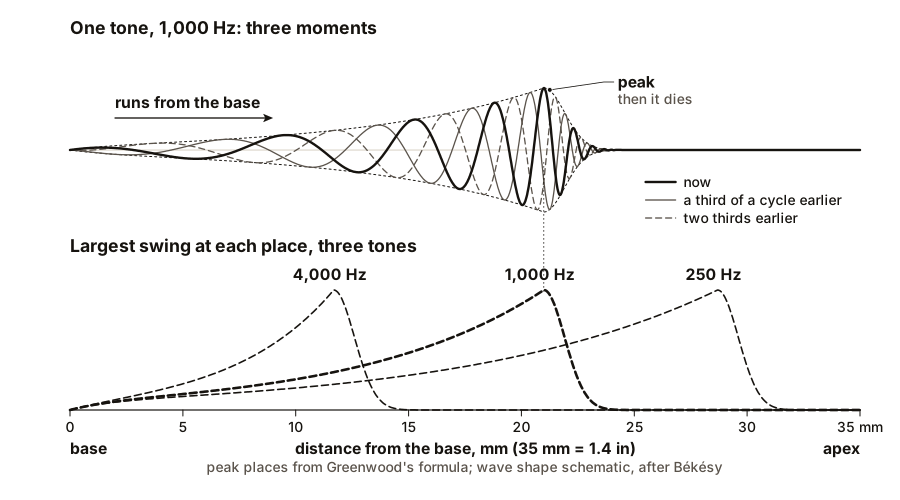
Békésy’s peaks were broad. A single tone moved a long stretch of membrane, and that left a puzzle, because people can tell apart two tones far closer than his peaks could. The answer came after him. Measurements in living animals from 1971 onwards found peaks many times sharper than in dead tissue, and in the 1980s it was shown that the roughly 12,000 outer hair cells change length in step with the sound, pumping energy into the wave at the right place. The living cochlea is a resonator bank with its own amplifier. A healthy ear even gives out faint sounds of its own, first recorded by David Kemp in 1978.
SLOW DOWN. Check Your Understanding: The chapter 1 plate has a Q of several hundred, so at 512 Hz its peak is about 1 Hz wide. The ear’s frequency channels near 1,000 Hz are roughly 130 Hz wide, a Q of about 8 (Glasberg and Moore, Hearing Research 47, 1990). Why would evolution build an ear out of such blunt resonators, when the plate shows that sharp ones are possible? Answer before you read on.
Because a sharp resonator is slow. Chapter 9 showed that a resonator’s Q is also a measure of how long it keeps ringing: the higher the Q, the longer the ring-down. The plate at Q 500 rings for a large fraction of a second after the drive stops. A cochlear channel at Q 8 rings for a few thousandths of a second. An ear built of plate-sharp resonators would hear every syllable smeared into the next, and would be unable to tell when a twig snapped. The ear trades sharpness in frequency for sharpness in time, and the brain recovers finer pitch by comparing neighbouring channels. No resonator can be both sharp in frequency and quick in time. It is the same trade your analyser app makes when you change its resolution setting.
Section 5: Where Hearing Breaks
The hair cells are the weak link. They do not grow back. Each loud exposure bends their bristles harder than they were built for, and past a point the damage is permanent. Because the membrane is a map, damage shows up as a hole in the map: a band of frequencies you no longer hear well, while the rest stay normal.
Noise damage has a signature. A hearing test plots your threshold at each frequency, and the audiogram of a person deafened by noise shows a dip between about 3,000 and 6,000 Hz, most often deepest at 4,000 Hz, with better hearing again at 8,000 Hz. Audiologists call it the noise notch, and NIOSH’s 1998 criteria document on occupational noise discusses it. Why that band is hit first is only partly understood. Two reasons are usual. The ear canal’s resonance boosts broad noise most between 2,000 and 4,000 Hz, so more energy reaches the cochlea in that band. And an overload damages the membrane about half an octave above the frequency that caused it, pushing the worst damage up towards 4,000 Hz. Neither alone explains every case.
Ringing in the ears after a loud evening, tinnitus, is a warning that hair cells have been pushed into temporary failure. It, and the muffled feeling with it, usually fades within a day. Repeated often enough, it stops fading. That is why the bench rule from Chapter 1 stands: above 85 dBA on the meter, plugs or muffs.
Age takes hearing from the top down: the base of the membrane, where high frequencies live, takes the force of every sound on its way past, and wears first. A child can usually hear up to about 20,000 Hz. Many adults have lost the top few thousand hertz of that range by middle age, and in old age the loss commonly reaches down to 8,000 Hz and below. Individuals vary widely in both directions.
ON THE BENCH: Your own upper limit
Parts: a laptop or phone running the tone generator, played through its own speaker; a second phone running the spectrum analyser; the sound meter app. Cost: nothing. Time: 10 minutes. Hazards: never use earbuds or headphones for this, and never turn the volume up to chase a fading tone. High tones can be harmful before they sound loud, and a tone that seems to vanish may still be strong. If your ears ring at any point, stop for the day. Method: play 1,000 Hz and set the volume so the meter reads about 60 dBA at your ear, about conversation level, with the speaker at arm’s length. Leave the volume there. Put the analyser phone beside the speaker. Step the tone up: 4,000, 8,000, 10,000 Hz, then in steps of 500 Hz. At each step, check the analyser shows a spike at the frequency you set, then listen. When you can no longer hear it, step back down until you can, in steps of 100 Hz. That frequency is your upper limit at this level. What you should see: the tone grows thinner and harder to place, and then is gone, while the analyser still shows the spike standing where it was. That is the check that can fail: if the analyser spike vanishes at the same moment the sound does, you have found the limit of the speaker, not of your ear. Many phone speakers give up near 16,000 Hz. Try a different device and repeat. If it does not work: if the analyser shows nothing above some frequency, its own microphone may stop there; set its range to 20,000 Hz and, failing that, borrow another device. Better, if you have one: test each ear separately, with a finger pressed over the other ear’s canal. A difference of more than 1,000 to 2,000 Hz between ears is worth a professional hearing test.
Section 6: What the Ear Is
The outer ear tilts a sound’s spectrum towards speech. The middle ear turns a swing in light air into a push in heavy water. The cochlea lays a graded membrane through that water, so each frequency piles up at its own place, where inner hair cells report the motion and outer ones amplify it. It is a resonator bank, Helmholtz’s piano built with travelling waves and powered by living cells.
That gives you a new way to look at the plate. Each figure on it is one resonance with one shape. The cochlea is the opposite arrangement, a different resonance at every point. A plate draws a shape for each frequency. The cochlea draws a place for each frequency.
The next two chapters leave the body and go back out into the air, which also resonates. A room has its own natural frequencies and its own ring-down, and in 1895 a young Harvard physicist was handed a lecture room that rang so long nobody could understand the lecturer.

Bench Degree
Get the degree without the diploma.
Learn the material, not how to pass the exam.