Bench Degree·NUCLEAR POWERchapter
Chapter 7: How Much Is Dangerous, and What Nobody Knows
Above about 100 mSv the numbers are solid and nobody serious argues. Below it, competent bodies disagree in print, and the only honest thing to do is say so and name them.
Chapter 6 ended on a factor of ten. People in Kerala and in Ramsar live under natural backgrounds many times the world average, they have been followed for hundreds of thousands of person-years, and nothing has been detected. That is the strongest single piece of evidence anybody has about low doses, and it is not enough.
This chapter is about the gap between what has been measured and what is assumed, because very nearly every radiation figure the public argues over lives inside that gap. It comes in three parts. The shape of the dose-response curve below 100 mSv, which is not known. The doses the accidents actually delivered, which are known and are smaller than almost anyone expects. And why those two facts have never managed to reach the people who need them.
Section 1: Linear No Threshold, Presented as the Live Question It Is
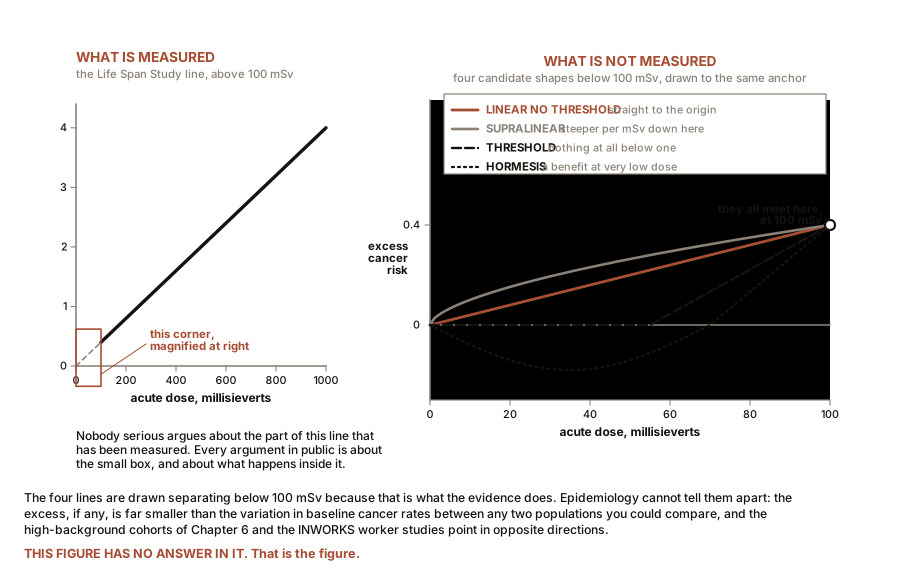
Below about 100 mSv (10 rem), nobody knows the shape of the dose-response curve, and this section explains why that sentence is not a dodge.
What is actually known. Above roughly 100 to 200 mSv, cancer risk rises with dose, and the relationship is approximately linear. The main evidence is the Life Span Study of about 120,000 survivors of Hiroshima and Nagasaki, followed since 1950, which is the most thoroughly studied radiation-exposed population that exists. Nobody serious disputes this part.
What is assumed. The linear no threshold model, LNT, extends that straight line down to zero: every dose, however small, carries proportionate risk, and there is no level below which risk vanishes. The ICRP’s nominal figure is about 5 percent excess fatal cancer risk per sievert across a whole population, which under LNT makes 1 mSv worth roughly a 1 in 20,000 lifetime chance, against a baseline lifetime cancer death risk of 20 to 25 percent.
Why it is used. LNT is the basis of essentially all radiation regulation worldwide, for three reasons that are about administration rather than biology. It is simple, which makes limits enforceable. It is additive, so doses from different sources can be summed and a total budget managed. And it is conservative, so if it is wrong it is most likely wrong in the direction of over-protection.
What supports it below 100 mSv. The INWORKS studies, pooling over 300,000 nuclear industry workers in France, the UK and the United States with a mean cumulative dose around 20 mSv accumulated slowly, have reported excess leukaemia and solid cancer risks broadly consistent with linear extrapolation. Studies of paediatric CT have reported dose-related increases in leukaemia and brain tumours, though these are contested on the ground that children who get head CTs may have been scanned because something was already wrong.
What argues against it below 100 mSv. The high-background cohorts of Chapter 6 Section 4. The radiobiology of Chapter 6 Section 1, where the natural double-strand break load dwarfs the radiation-induced one at these doses. Evidence for adaptive cellular responses at low dose rates. And the general argument that a mechanism with a repair step in it has no obvious reason to be strictly linear at the bottom.
Where the institutions actually stand, which is more nuanced than either side’s summary:
The ICRP retains LNT for setting protection limits, and states explicitly that it is not appropriate to use collective dose to calculate numbers of deaths from small doses spread over large populations. That is not a footnote. The body that maintains the model says the model should not be used the way it is most often used in public. UNSCEAR takes the same position and declines to project death tolls in its Chernobyl and Fukushima reports. The French Academy of Sciences and National Academy of Medicine, jointly in 2005, argued against LNT below about 100 mSv. The US National Academies’ BEIR VII, 2006, concluded a linear model remains the most reasonable description. The Health Physics Society recommends against quantitative risk estimates below 50 mSv in a year or 100 mSv in a lifetime.
So: a live disagreement among competent people, on the record, and not consensus against cranks in either direction.
What would settle it. Not epidemiology alone. Detecting a risk of 1 in 20,000 against a 40 percent background incidence needs cohorts far larger and more precisely dosed than any that exist, and confounders grow faster than sample size. The realistic routes are mechanistic: whether repair fidelity for clustered damage differs at low dose, and a biological marker that distinguishes a radiation-caused cancer from any other. The Million Person Study of American radiation workers and veterans is the largest attempt currently running.
Section 2: The Accident Doses, Stated Plainly
Chapters 15 and 16 give the mechanical account of each accident. This section gives only the doses and the health outcomes, from the investigation reports.
Three Mile Island, 1979. The average dose to the roughly two million people within 80 km (50 miles) was about 0.01 mSv (1 mrem), and the maximum offsite dose to any individual about 1 mSv (100 mrem), against a local natural background of 1 to 1.25 mSv per year. The average exposure was about three days of ordinary background and the worst case about one year of it. No deaths, no injuries, and four decades of epidemiological follow-up have found no radiation-attributable health effects.
Chernobyl, 1986. This one killed people and the figures are grim.
Two plant workers died on the night, one immediately and one of injuries. 134 plant staff and firefighters were diagnosed with acute radiation syndrome, and 28 of them died within the following months. Nineteen more of that group had died by 2004, of causes not all attributable to radiation. Those are counted deaths of identified individuals and they are not in dispute.
About 6,000 cases of thyroid cancer occurred among people who were children or adolescents at the time, caused by iodine-131 concentrating in the thyroid, largely delivered through contaminated milk that was not interdicted. Fifteen deaths from those cancers had occurred by 2005. This was preventable. Distributing stable iodine and stopping milk distribution in the first days would have removed most of it, and the Soviet authorities did neither in time.
Population doses, from UNSCEAR 2008: about 530,000 recovery workers averaged around 120 mSv (12 rem); about 115,000 people evacuated in 1986 averaged around 30 mSv (3 rem); and 6.4 million residents of contaminated areas averaged about 9 mSv (0.9 rem) over the twenty years to 2005.
Then the projections, which are the contested part. The 2005 Chernobyl Forum estimated up to about 4,000 eventual excess cancer deaths among the most exposed 600,000 people. Campaigning organisations have published figures in the tens and hundreds of thousands.
Every one of those numbers, high and low, is a model output rather than a count, produced by multiplying a collective dose by a risk coefficient under LNT, which is precisely the procedure the ICRP says should not be used this way. UNSCEAR declines to publish such a projection at all. The 4,000 figure is not a measurement and neither is the 200,000 figure, and anyone quoting either as a death toll is misrepresenting it. What is measurable is 30-odd acute deaths, 6,000 thyroid cancers with 15 deaths by 2005, and a large body of evidence of psychological and social harm.
Fukushima, 2011. The earthquake and tsunami killed about 19,750 people with about 2,550 still missing. The reactor accident killed none of them.
There were no deaths from acute radiation exposure. No worker or member of the public received a dose in the deterministic range. Six workers exceeded 250 mSv (25 rem) and around 170 exceeded 100 mSv (10 rem). One death, of lung cancer in a worker, was accepted for compensation by a Japanese labour ministry panel in 2018; a compensation ruling is an administrative decision under a generous standard of proof and is not a scientific causal finding, and this book says so because the distinction is routinely elided in both directions.
Public doses were low. UNSCEAR’s 2013 assessment, reaffirmed in 2020, found first-year effective doses for most residents below 5 mSv (500 mrem), with a maximum around 25 mSv (2,500 mrem), and concluded that no discernible increase in radiation-related health effects is expected. Thyroid doses were far below Chernobyl’s, because milk and food were interdicted quickly.
The thyroid cancers found in Fukushima children require care. A mass ultrasound screening programme examined roughly 300,000 young people and found a few hundred thyroid abnormalities. UNSCEAR attributes this predominantly to the screening effect: ultrasound at that sensitivity finds indolent thyroid cancers that would never have caused symptoms, and screening any comparable population would find a similar number. That is a genuinely contested judgement, but it is the assessment of the body with the fullest dose data, and the pattern of the findings does not match dose.
And now the part that matters most. About 160,000 people were evacuated. Roughly 2,300 deaths in Fukushima prefecture have been officially classified as disaster-related rather than caused directly by the tsunami, overwhelmingly among elderly and frail people, from the evacuation itself and from prolonged displacement: hospitals and care homes emptied under time pressure, interrupted treatment, and the mortality that follows moving the very old.
The evacuation caused far more deaths than the radiation did. That is the central finding of Fukushima and it is not an argument that the evacuation was wrong. Some of it was clearly necessary; the mandatory zone was decided with almost no dose information in the first two days. The finding is that protective action is itself a hazard and must be weighed as one, which was not previously part of emergency planning anywhere and now is.
Section 3: Why Perception and Evidence Diverge
Because this chapter has given figures that will strike some readers as too reassuring and others as too grim, it owes an account of the gap. Four reasons, and none of them is that the public is stupid.
Detection outruns harm by a factor of a million, so “detected” is always available as a headline and never means anything.
The psychology is well characterised. Hazards that are involuntary, invisible, unfamiliar and catastrophic in their worst case are consistently rated far more dangerous than their statistics warrant. Radiation scores maximum on all four. Driving scores low on all four and kills vastly more people.
The word is shared with weapons, which no other energy technology has to carry, and Chapter 17 exists because of it.
And both sides have earned distrust. Windscale’s release was downplayed at the time; the Soviet response to Chernobyl included days of silence while children drank contaminated milk; Hanford and other weapons sites concealed releases for decades. That history is why “the authorities say it is safe” is not a persuasive sentence. In the other direction, published Chernobyl death-toll estimates differing by a factor of fifty cannot all be honest work, and treating a model output as a body count is misrepresentation whoever does it.
The response to both is this book’s method: cite the document, state the assumptions, give the baseline, say what is not known.
ON THE BENCH: Your own annual dose budget
Parts: the NCRP or UNSCEAR table in Chapter 6; your radon result; your Geiger table from Chapter 1; your flight log; your medical records. Cost: nothing. Time: an hour, and it is a calculation rather than an experiment. Method: start from the natural subtotal for your country. Replace the generic radon figure with your own measured one, scaled by the fraction of the year you spend at home. Add 0.005 mSv (0.5 mrem) per hour aloft. Add your actual imaging from Chapter 6’s table. Add roughly 0.5 mSv (50 mrem) a year if you live at Denver’s altitude rather than sea level. What you should find: a personal total between about 1.5 and 15 mSv (150 to 1,500 mrem) a year, dominated by two entries and only two: radon and medical imaging. If either is large in your budget it is worth a conversation. Nothing else on the list is. The point of doing it: the next time a figure appears in the news you have a personal denominator to divide it by, which is the only thing that makes such a figure mean anything.
SLOW DOWN. Check Your Understanding: Take LNT at face value. World population 8 billion, natural background 2.4 mSv per year, ICRP risk coefficient 5 percent excess fatal cancer per sievert. Multiply those out and natural background alone should be causing something like 960,000 excess cancer deaths a year worldwide. Is that number real, and how would anyone ever find out? Answer before reading on.
The arithmetic is right and the number is not a finding. It is what LNT plus a collective dose produces, and it is exactly the calculation the ICRP says must not be made.
Here is why it cannot be checked. Roughly 10 million people die of cancer a year, so an extra 960,000 would be a ten percent effect, which sounds detectable. There is nothing to compare it against. There is no unexposed control population anywhere on earth and never has been. The variation that does exist, the factor of ten between low-background and high-background regions, was studied in Chapter 6 Section 4 and yields no detectable difference.
An unfalsifiable calculation is not a result. That is why the ICRP prohibits this one: not because the answer is awkward, but because multiplying a tiny per-person risk by a very large population manufactures a large, confident-looking number out of an assumption never tested at that dose.
The same objection applies with equal force to the accident projections in Section 2. The 4,000 figure for Chernobyl and the six-figure alternatives are the same operation on a different collective dose, and consistency requires treating them the same way. The counted deaths are the counted deaths: 28 from acute radiation syndrome, 15 thyroid cancer deaths by 2005, and the two on the night. Everything beyond that is a model, and models should be labelled.
Section 4: What to Carry Forward
Detection is a million times more sensitive than harm, so “radiation detected” is never news on its own, and every dose figure needs a stated baseline.
Deterministic effects have thresholds and are certain above them; stochastic effects are probabilistic and leave no marker. Never argue about one using the other’s logic.
Your dose is dominated by radon and medical imaging, in that order, and the nuclear power industry contributes about one twenty-thousandth of it.
Below about 100 mSv the shape of the dose-response curve is genuinely unknown, competent bodies disagree in print, and epidemiology alone is unlikely to settle it.
Collective dose multiplied by a risk coefficient is not a death toll, and the organisation that maintains the coefficient says so.
Chernobyl’s counted deaths are about 30 acute plus 15 thyroid by 2005, and its 6,000 thyroid cancers were largely preventable with stable iodine and a milk ban.
Fukushima’s radiation killed nobody and its evacuation killed roughly 2,300 people, which made protective action itself something that has to be weighed.
And go and test your basement.
Next: what actually happens inside the fuel, and why slowing a neutron down makes it more dangerous to a nucleus rather than less.

Bench Degree
Get the degree without the diploma.
Learn the material, not how to pass the exam.