Bench Degree·NUCLEAR POWERchapter
Chapter 6: Radiation and the Human Body
The chapter this book has to get right. Every number here is sourced, every unit is given twice, and where the science is genuinely unsettled this chapter says so and names who disagrees rather than picking a side and pretending.
Two ground rules first, because everything after them depends on them.
Radiation is detectable at levels around a millionth of the level at which it does measurable harm. No other hazard has that property. A Geiger counter will tell you that a granite countertop is above background, and that fact is true, and it means nothing. The phrase “radiation was detected” carries no information at all, and the entire public discourse on this subject is built on treating it as though it did.
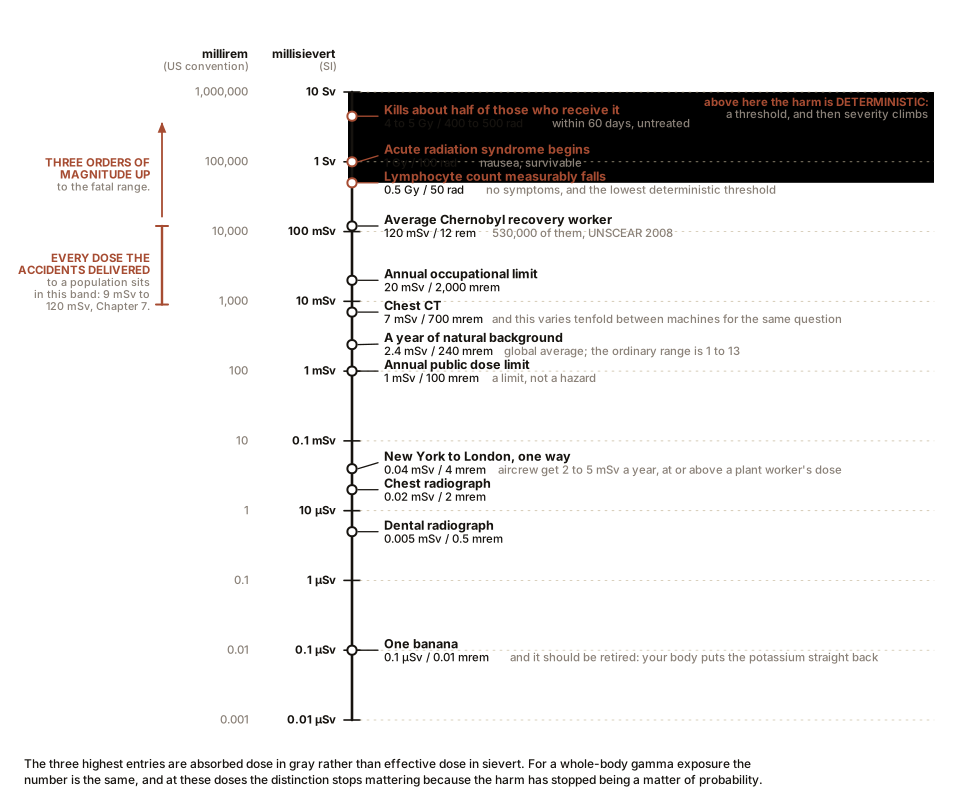
And every figure in this chapter is a comparison, so every figure needs a stated baseline. A dose of 10 mSv means nothing on its own. Against a global average natural background of 2.4 mSv per year, it is four years of ordinary living. Against the 5,000 mSv that kills half the people who receive it in an hour, it is a five-hundredth. Both comparisons are honest and they feel completely different, which is exactly why this book always states which one it is making.
Units, once more. 1 sievert = 100 rem, and 1 mSv = 100 mrem. American figures are usually in millirem, everyone else’s are in millisieverts, and this chapter gives both every time.
Section 1: What Actually Happens in a Cell
Ionising radiation strips electrons from molecules. In a cell most of those molecules are water, and the reactive fragments go on to damage other things, including DNA. Radiation also hits DNA directly.
The damage that matters is the double-strand break, where both strands of the helix are cut at nearby points. A single-strand break is repaired accurately using the intact strand as a template. A double-strand break has no template, and the repair is sometimes wrong.
Now the numbers, which are the part usually left out. A dose of 1 mGy of gamma produces roughly one electron track through a typical cell nucleus and about 0.04 double-strand breaks per cell. Ordinary metabolism, entirely unrelated to radiation, produces on the order of 10 to 50 double-strand breaks per cell per day plus tens of thousands of lesser lesions. Those figures come from radiobiology reviews, they vary with cell type and measurement method, and they are order of magnitude rather than precise.
So a year of natural background delivers to each cell roughly one twentieth of the double-strand break load it sustains from being alive for a single day.
That comparison cuts in an inconvenient direction and this book states it anyway. It is a real argument that low-dose risk should be small. It is not an argument that it is zero, because repair machinery is tuned to the damage it normally sees and radiation damage is more clustered. Chapter 7 is where that argument lives; the number is here because you cannot evaluate that chapter without it.
Section 2: Two Completely Different Kinds of Harm
Everything about this subject becomes clearer once these are kept apart.
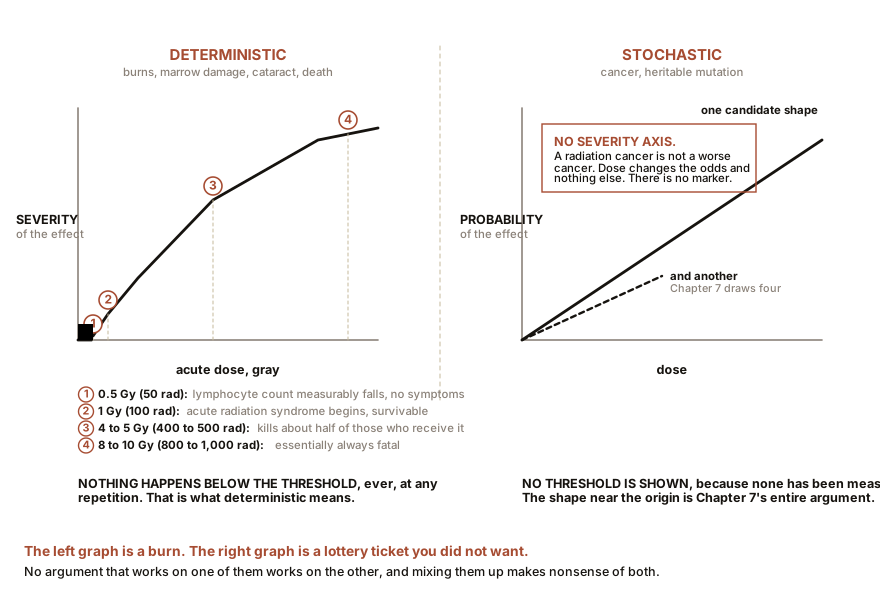
Deterministic effects happen because enough cells in a tissue were killed for the tissue to stop working. They have a threshold: below it, nothing happens, because the tissue replaces what it lost. Above it, severity rises with dose, and the effect is prompt and certain. These are not statistical. If you receive the dose, you get the effect.
The thresholds, for acute whole-body dose:
| Acute dose | What happens |
|---|---|
| below 0.1 Gy (10 rad) | nothing clinically observable |
| 0.5 Gy (50 rad) | measurable fall in lymphocyte count, no symptoms |
| 1 Gy (100 rad) | acute radiation syndrome begins, nausea, survivable |
| 2 to 6 Gy | serious marrow damage, requires intensive treatment |
| 4 to 5 Gy | kills about half of those who receive it within 60 days, untreated |
| above 8 to 10 Gy | essentially always fatal |
Local thresholds are lower for some tissues: skin reddening at around 2 Gy, temporary hair loss at around 3 Gy, and cataract formation in the lens of the eye, which the ICRP revised downward in 2011 to around 0.5 Gy.
Stochastic effects are cancer and heritable mutation. Here dose does not change the severity, it changes the probability. A cancer caused by radiation is indistinguishable, in the patient and under the microscope, from one that was not. There is no marker. This is the whole of the difficulty, and every argument in Chapter 7 follows from it.
IN PLAIN ENGLISH: A deterministic effect is a burn. Enough heat and your hand blisters; less than enough and nothing happens at all, ever, no matter how often you do it. A stochastic effect is a lottery ticket you did not want. Radiation buys you extra tickets, the draw is decades away, and if your number comes up nothing about the illness tells you which ticket won. That is why the two kinds of harm need completely different arguments, and why mixing them up makes nonsense of both.
Section 3: The Background You Already Live In
Here is the table. The right-hand column is the American convention and it is the same numbers.
Global averages, natural sources only, per year (UNSCEAR 2008):
| Source | mSv per year | mrem per year |
|---|---|---|
| Radon and thoron, inhaled | 1.26 | 126 |
| Cosmic rays | 0.39 | 39 |
| Terrestrial gamma from soil and rock | 0.48 | 48 |
| Internal, mostly potassium-40 | 0.29 | 29 |
| Total natural | 2.4 | 240 |
That global average conceals an enormous spread. UNSCEAR gives the ordinary range as 1 to 13 mSv per year, which is the factor-of-ten variation you measured yourself with a Geiger counter in Chapter 1.
United States, all sources, per year (NCRP Report 160, 2009):
| Source | mSv per year | mrem per year |
|---|---|---|
| Radon and thoron | 2.28 | 228 |
| Internal | 0.29 | 29 |
| Cosmic | 0.33 | 33 |
| Terrestrial | 0.21 | 21 |
| Natural subtotal | 3.11 | 311 |
| Computed tomography | 1.47 | 147 |
| Nuclear medicine | 0.77 | 77 |
| Interventional fluoroscopy | 0.43 | 43 |
| Conventional radiography | 0.33 | 33 |
| Medical subtotal | 3.00 | 300 |
| Consumer products | 0.13 | 13 |
| Total | 6.2 | 620 |
Read that table twice. In the United States, medical imaging delivers as much dose to the population as all natural sources combined, and radon delivers more than any other single source of anything. The nuclear power industry does not appear, because its contribution to public dose is around 0.0003 mSv per year, roughly one twenty-thousandth of the total, and rounds to zero at this precision.
Some individual figures, all of which vary widely between machines and protocols:
| Exposure | Dose | Imperial |
|---|---|---|
| One banana | 0.1 µSv | 0.01 mrem |
| Dental radiograph | 0.005 mSv | 0.5 mrem |
| Chest radiograph | 0.02 mSv | 2 mrem |
| New York to London, one way | 0.04 mSv | 4 mrem |
| Mammogram | 0.4 mSv | 40 mrem |
| Head CT | 2 mSv | 200 mrem |
| Chest CT | 7 mSv | 700 mrem |
| Abdomen and pelvis CT | 8 to 10 mSv | 800 to 1,000 mrem |
| PET combined with CT | 25 mSv | 2,500 mrem |
The CT figures are the ones worth taking seriously, and they range by a factor of about ten between a well-optimised modern scanner and a badly set-up older one, for the same clinical question. That variation is larger than any dispute about nuclear power.
Two entries deserve a note.
The banana is a bad unit and should be retired. A banana holds about 450 mg (0.016 oz) of potassium and therefore about 14 Bq of potassium-40. But your body regulates its potassium tightly: eating a banana does not raise your potassium-40 burden, it displaces some, and within hours you are back where you started. The banana equivalent dose is a real number describing a thing that does not happen.
And aircrew are among the most exposed occupational groups in the world, at 2 to 5 mSv per year (200 to 500 mrem) from cosmic rays at altitude, which is comparable to or above the average measured dose of a nuclear power plant worker. That is not a hypothetical and it is not controversial; it is simply not what anyone expects.
ON THE BENCH: Test your own house for radon, and this is the one to actually do
Parts: a short-term charcoal canister test kit, $15 to $30 including the laboratory analysis, or a long-term alpha-track detector for about the same. A continuous electronic radon monitor is $150 to $250 and worth it if you want to watch it change. Cost: $15 to $250. Time: two to seven days for a charcoal kit, three to twelve months for an alpha-track detector, both largely unattended. Hazards: none. The hazard is the radon you already have, and this measures it. Method: put the detector in the lowest lived-in level of the house, away from draughts, exterior walls and damp, at least 500 mm (20 in) off the floor. Keep windows and outer doors shut for the duration and for twelve hours before a short test. What you should see: most houses read below 50 Bq/m³, which is 1.4 pCi/L. The WHO reference level is 100 Bq/m³ (2.7 pCi/L) and the US action level is 148 Bq/m³ (4 pCi/L). Basements read higher than upper floors, winter higher than summer, and a house on granite or shale higher than one on clay. If it comes back high: retest, because short-term results swing with the weather. If a long-term test confirms it, the fix is sub-slab depressurisation: a pipe through the floor slab, a small continuously running fan, and a discharge above the roof line. Typically $800 to $2,500 installed, and it reliably drops indoor radon by 80 to 99 percent. Why this is the most useful thing in the book. Radon is the largest single component of the average person’s dose, the second leading cause of lung cancer after smoking, and it varies by more than a factor of a hundred between neighbouring houses. Every other radiation risk in this volume is somebody else’s to manage. This one is yours.
Section 4: Places Where the Background Is Very High
If low-dose radiation is harmful in proportion to dose, then people living where the background is ten or thirty times the average should show it. Several such places exist and have been studied.
Ramsar, in northern Iran. Hot springs deposit radium, and dose rates in a few dwellings reach around 130 mSv per year (13 rem), with many residents in the 6 to 30 mSv range. That is above the occupational limit for a radiation worker anywhere in the world, received continuously, for generations.
Kerala, in southern India. Monazite sands give 4 to 70 mSv per year. A cohort study published in 2009 followed about 69,000 people for roughly 385,000 person-years and found no statistically significant excess of cancer with cumulative dose.
Yangjiang, in southern China, at around 6.4 mSv per year, has been studied for decades with similar results.
What these studies do and do not establish matters more than the headline.
They do establish that whatever the low-dose risk is, it is small enough to be invisible in cohorts of tens of thousands followed for decades. That is a real constraint.
They do not establish that it is zero. The Kerala confidence intervals are wide enough to contain the risk a linear model predicts; cohorts of that size cannot resolve a few extra cancers against a lifetime cancer incidence near 40 percent; and the confounders are hard to remove, including migration, smoking, diet, reporting differences, and the fact that dose is estimated from where people live rather than measured on them.
A study that cannot detect an effect has not shown the effect to be absent. Saying so is the difference between citing a study and using it.
That is where the argument begins rather than where it ends. The next chapter takes the same evidence and asks what it licenses: what is genuinely known above 100 mSv, what is assumed below it, what the accidents actually delivered to the people who were there, and why none of it has ever settled anything in public.

Bench Degree
Get the degree without the diploma.
Learn the material, not how to pass the exam.