Bench Degree·PLASMAchapter

Chapter 13: Plasma in Space
Almost all the visible matter in the universe is plasma, and the nearest of it starts about 60 km (37 miles) above your head. A thirty-dollar radio will let you hear it, and the reason it works at midnight and not at noon is the number Chapter 2 handed you.
You cannot make any of the plasma in this chapter on a bench. It is thousands of kilometres away at the nearest, it is held together by gravity or by planetary magnetic fields, and the smallest specimen in it is larger than a continent.
You can measure it, though, and that distinction matters. The ionosphere is one of the very few large natural plasmas an ordinary person can probe from a chair, because it announces its own state on the shortwave bands, continuously, for free.
So this chapter explains, and its experiments are observations rather than apparatus.
ON THE BENCH: Sound the ionosphere with a radio
Parts: any receiver covering roughly 3 to 30 MHz. A cheap portable with a whip works, from $30. Or use one of the many public receivers on the internet, which costs nothing and is genuinely the same measurement. Cost: $0 to $40. Time: 20 minutes at noon and 20 at midnight, repeated over a week. Hazards: none. Method: at local noon, tune slowly from 3 MHz to 30 MHz and write down, band by band, whether you hear distant stations, local stations only, or nothing. Repeat at local midnight. Keep the log for a week. What you should see, and it is stark: at noon the low end is dead and the high end is alive. Below about 7 MHz you hear almost nothing beyond a few hundred kilometres; between 14 and 30 MHz you hear other continents. At midnight the pattern inverts: 3 to 7 MHz fills with signals from thousands of kilometres away, and above 20 MHz there is nothing. Do the same on a car radio. Count the AM stations at noon, then again at one in the morning. The band that held four stations now holds forty, from three countries. Nothing changed about the transmitters. What changed is 90 km (56 miles) above your head. Better, if you have one: an ionosonde plot. National agencies publish real-time soundings of the layer overhead. Compare your log against the trace and you will find you measured the same thing.
ON THE BENCH: Watch a space weather event happen
Parts: an internet connection, and a phone with a magnetometer, which is any phone with a compass, plus a free app. Cost: nothing. Time: ten minutes a day for a month. Hazards: none. Method: each day note four published figures: the sunspot number, the solar wind speed and density measured upstream at the first Lagrange point, the north-south field component in that wind, and the planetary K index, a nought-to-nine scale of geomagnetic disturbance. All four are published free in real time. When K goes above 5, go outside and look toward the pole. What you should see: the causal chain, in order, with your own timestamps on it. A large sunspot group appears. A flare is reported. One to three days later the wind speed jumps from around 400 to perhaps 700 km/s (250 to 430 miles/s) and the density spikes. If the north-south field component swings strongly negative at the same time, the K index climbs within the hour. If it stays positive, very little happens even from a fast, dense arrival, and Section 6 explains why that one component decides everything. And check your own magnetometer. During a strong storm a phone lying still, well away from steel and wiring, shows the horizontal field wandering by tens of nanotesla over minutes. You are measuring the current system that brought down the Québec grid, from a kitchen table, with a consumer sensor.
Section 1: The Sun, Which Is Nearly All of It
The sun holds 99.86 per cent of the mass of the solar system, and it is plasma throughout at wildly different conditions in each layer.
The core, at about 15.7 million K, is completely ionised: bare nuclei and free electrons, nothing recognisable as an atom.
The photosphere, the visible surface, at 5,772 K. And here is a result that would have seemed impossible before Chapter 3. At that temperature only about one part in ten thousand of the hydrogen is ionised. The visible surface of the sun is, by degree of ionisation, a barely ionised gas, and it is nonetheless a thoroughly convincing plasma by Chapter 2’s criteria. You need very little.
And then the corona, the tenuous outer atmosphere visible during a total eclipse, at 1 to 3 million K.
Read those last two together. The surface is at 5,772 K and the thin gas above it is at a million. Heat does not flow from cold to hot, so something is doing work up there, and after eighty years of investigation it is genuinely not settled which of two mechanisms dominates. Either the field lines are continually twisted and reconnected in vast numbers of events too small to see individually, which is the nanoflare picture, or waves travelling up the field lines from the churning surface dissipate their energy in the corona, which is the Alfvén wave picture. Both happen. Which supplies most of the energy is the question.
It is a question with a plan attached, which is the right way to hold an open question. The Parker Solar Probe has been flying through the corona since 2018 to measure the wave power and small-scale field structure directly. What would settle it is measurement of heating events below the size and duration current instruments can resolve, and that is what the mission is for.
Section 2: The Solar Wind, and the Spiral It Draws
In 1958 Eugene Parker argued that the corona is too hot for the sun’s gravity to hold down, so it must be escaping continuously, in all directions, forever. The paper was rejected by two referees before Subrahmanyan Chandrasekhar published it over their objections. Mariner 2 confirmed it in 1962.
Speed: 300 to 500 km/s (190 to 310 miles/s) for the slow wind and 700 to 800 km/s (430 to 500 miles/s) for the fast wind streaming out of coronal holes, with a transit time to Earth of two to four days. Density at Earth’s orbit: about five protons per cubic centimetre, a better vacuum than anything achievable in a laboratory, and still a plasma by every criterion in Chapter 2 because the Debye length out there is a matter of metres and the region is astronomical. Mass loss: roughly 1.5 million tonnes (1.7 million short tons) every second, which sounds catastrophic and amounts to a small fraction of a per cent of the sun’s mass over its whole life.
And it carries the sun’s magnetic field with it, which is Chapter 11’s frozen-in field working at solar-system scale. The wind streams radially outward while the sun rotates underneath it once every 27 days, so a field line with one end anchored on the rotating sun and the rest dragged straight out is wound into a spiral, like water from a rotating sprinkler. At Earth’s orbit that spiral crosses the radial direction at about 45 degrees. It is called the Parker spiral, and spacecraft measure it exactly where the geometry says.
Section 3: What Happens When It Reaches Us
Earth has a magnetic field, and Chapter 11 said a magnetic field has a pressure. So there is a fight, and the fight has a boundary.
On the sunward side, the solar wind’s dynamic pressure and the Earth’s magnetic pressure balance at about 64,000 km (40,000 miles) out, which is ten Earth radii. Both pressures there are around a nanopascal, a ten-billionth of atmospheric. Two of the feeblest pressures imaginable, in balance, setting the shape of a structure larger than the planet. In front of it stands a bow shock, because the wind arrives faster than the local wave speed. Downwind the field is stretched into a magnetotail reaching past the Moon’s orbit. In severe storms the boundary has been driven inside geostationary orbit, leaving communications satellites sitting in the raw solar wind, which is not what they were designed for.
The Van Allen belts were the first discovery of the space age, found by James Van Allen’s instrument on Explorer 1 in 1958: two regions where charged particles are trapped, bouncing along field lines between the hemispheres, because a field line that strengthens toward each end acts as a mirror and turns particles round. The inner belt, from roughly 1,000 to 12,000 km (600 to 7,500 miles), holds energetic protons; the outer, from about 13,000 to 60,000 km (8,000 to 37,000 miles), holds electrons. Which is why satellites live either below the belts or above the worst of them and not in between, and why every spacecraft crossing the South Atlantic Anomaly, where the field is weak and the inner belt dips low, logs a spike in memory errors.
Section 4: The Aurora, Explained Rather Than Photographed
Almost every popular account says the aurora is caused by solar particles hitting the atmosphere. That is wrong in an interesting way.
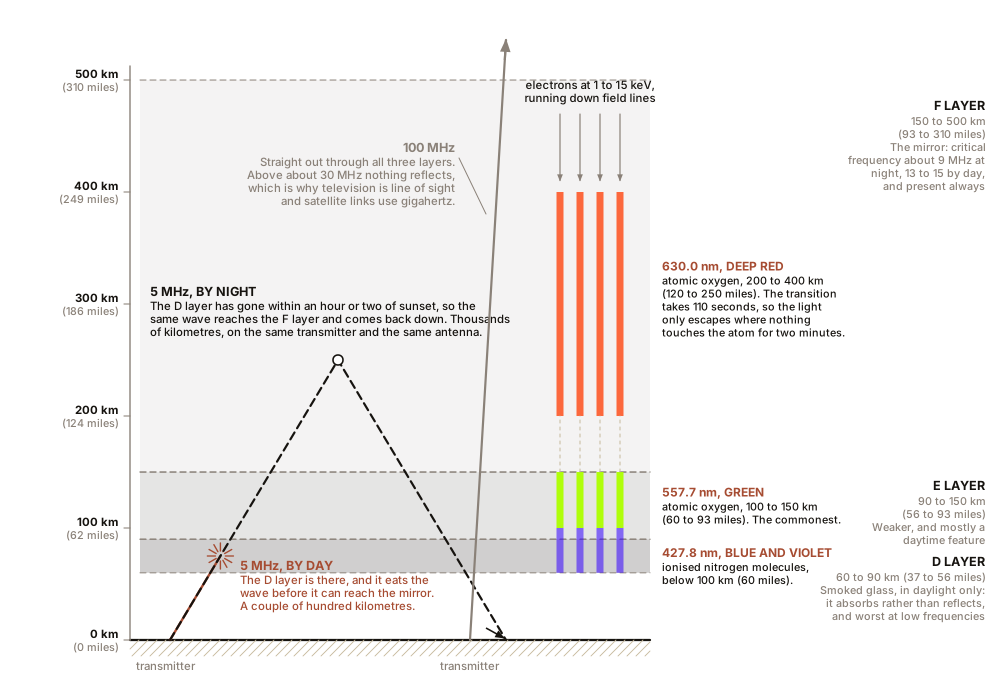
Solar wind particles do not arrive directly. They cannot: they would have to cross field lines, and Chapter 11 said they cannot. What happens is a chain. The solar wind’s own field reconnects with Earth’s at the nose of the magnetosphere, coupling energy in, and that energy is stored in the stretched magnetotail. The tail then reconnects too, snapping back like a released elastic band, which is a substorm, and it accelerates electrons already resident in the magnetosphere to 1 to 15 keV. Those electrons run down field lines into the upper atmosphere and excite the atoms they hit.
So the aurora is Chapter 9’s spectroscopy written across the sky, and the colour tells you the altitude and the gas:
| Colour | Wavelength | Emitter | Altitude |
|---|---|---|---|
| Green, the commonest | 557.7 nm | atomic oxygen | 100 to 150 km (60 to 93 miles) |
| Deep red, above the green | 630.0 nm | atomic oxygen | 200 to 400 km (120 to 250 miles) |
| Blue and violet, at the fringe | 427.8 nm | ionised nitrogen molecules | below 100 km (60 miles) |
And the reason red sits above green is beautiful. The red transition is slow: an excited oxygen atom takes an average of 110 seconds to emit that photon. Down at 150 km (93 miles), 110 seconds is long enough that the atom will certainly collide with something first and lose its energy without emitting. Only high up, where nothing touches it for two minutes, can the red light get out. The red aurora is a stopwatch: it appears only where collisions are rarer than one every hundred seconds.
And the curtains and rays are field lines. The shape of an aurora is the shape of the field it is falling along, which is why the rays are vertical, why the curtains have sharp edges, and why the whole display shifts as one.
Section 5: Why Shortwave Bounces at Night
Chapter 2 gave you a formula and promised it would pay off here. The plasma frequency in hertz is 8,980 times the square root of the electron density in electrons per cubic centimetre. Below that frequency a plasma is a mirror; above it, a window.
The ionosphere comes in layers because different wavelengths of sunlight are absorbed at different depths by different gases:
The F layer, 150 to 500 km (93 to 310 miles). The densest, the highest, and the one that does the long-distance work. At night its electron density is about 10¹² per cubic metre, a million per cubic centimetre, giving a critical frequency of about 9 MHz, exactly as Chapter 2 calculated. By day sunlight drives it two or three times higher and the critical frequency rises to 13 to 15 MHz.
The E layer, 90 to 150 km (56 to 93 miles). Weaker, mostly a daytime feature, occasionally erupting into intense patches that reflect 50 MHz for minutes at a time.
And the D layer, 60 to 90 km (37 to 56 miles). This is the one that decides the daily pattern, and it does not work by reflection at all.
One piece of geometry first. A wave arriving nearly vertically must be below the critical frequency to be reflected. A wave arriving at a shallow angle is reflected even well above it, in the same way light reflects off water at a glancing angle and enters it at a steep one. For a low take-off angle the highest usable frequency is roughly three times the vertical critical frequency, so a 9 MHz critical frequency supports a 25 MHz path.
SLOW DOWN. Check Your Understanding: The F layer is present day and night, and its critical frequency is higher by day. So by Chapter 2’s rule the ionosphere should be a better mirror at noon than at midnight. Yet the 3 to 7 MHz bands go thousands of kilometres at midnight and a couple of hundred at noon, as your radio log showed. What is going on? Answer before reading on.
It is the D layer, and it absorbs rather than reflects.
The D layer sits at the bottom of the ionosphere where the air is still comparatively dense. It is ionised by sunlight and, being dense, it recombines fast, so it exists only in daylight and is essentially gone within an hour or two of sunset.
Its density is far too low for its plasma frequency to reflect anything useful. What it does instead is Chapter 4’s mechanism working against you. A radio wave sets the free electrons oscillating, and down at that altitude an electron collides with a neutral molecule before it can complete an oscillation, and every collision turns a little of the wave’s energy into gas heating. The wave is not reflected and not transmitted. It is eaten.
And the absorption is far worse at low frequencies, falling roughly with the square of frequency. So by day the D layer is a sheet of smoked glass across the bottom of the ionosphere, opaque below about 7 MHz and increasingly transparent above. The F layer mirror is there all day. You just cannot get to it.
Which gives you the whole of shortwave practice in a paragraph. By day, work the high bands above 14 MHz, which punch through the D layer and reflect off a strong daytime F layer. By night, work the low bands, because the D layer has gone and the F layer, though weaker, is still a mirror there. And it scales: the AM broadcast band at around 1 MHz is absorbed so completely by day that it is a local service, and at night it crosses a continent.
Two consequences worth carrying. Above roughly 30 MHz nothing reflects under ordinary conditions, which is why FM and television are line-of-sight and why satellite links use gigahertz. And the whole system rides the eleven-year solar cycle: near maximum the F layer is denser, usable frequencies climb, and the 28 MHz band opens worldwide. Any radio amateur active for more than a decade has personally measured the sunspot cycle.
IN PLAIN ENGLISH: There is a ceiling over your head, about 250 km (155 miles) up, which is a mirror to long radio waves and a window to short ones. Beneath it, in daylight only, there is a layer of smoked glass that swallows the long waves before they can reach the mirror. Sunset removes the smoked glass and leaves the mirror. That is the entire explanation for why the world sounds different on a radio at midnight.
Section 6: Carrington, and the Arithmetic of Damage
On 1 September 1859, Richard Carrington was sketching sunspots in Surrey when two patches of blinding white light appeared on the sun’s disc. Richard Hodgson saw the same thing independently. It was the first observation of a solar flare.
The coronal mass ejection that followed reached Earth in about 17.6 hours, against the usual two to four days, implying an average speed near 2,400 km/s (1,500 miles/s). Aurorae were seen in Cuba, Hawaii and Panama, bright enough to read by. And the telegraph system failed in a revealing way. Operators received shocks, paper caught fire at some stations, and on several lines operators disconnected their batteries and continued sending messages on the current the sky was providing.
That last detail is the mechanism, so take it apart.
A geomagnetic storm changes the Earth’s field by hundreds of nanotesla over minutes, and a changing magnetic field induces an electric one. The ground is a conductor, so the induced field appears along the surface at roughly 1 to 10 volts per kilometre (1.6 to 16 volts per mile), worst over resistive igneous rock.
Now put a power line in it. A 500 km (310 miles) transmission line lying in a 5 V/km field has 2,500 V between its ends. Both ends are earthed through transformer neutrals, so that voltage drives a current, and because the storm’s changes take minutes, the current is effectively direct current as far as the transformer is concerned. Tens to a few hundred amps.
And a large transformer cannot tolerate direct current in its windings. Its core is designed for a symmetrical alternating flux right up to the edge of saturation. Add a steady offset and it saturates hard on one half of every cycle, and a saturated core no longer contains its own flux, so stray flux escapes into the tank walls and clamping steel and produces local hot spots of several hundred degrees. The oil gasses, the insulation degrades, and the unit can be destroyed. The distorted magnetising current is also full of harmonics and its reactive draw jumps, tripping relays and capacitor banks never meant to see this.
Which is what happened in Québec on 13 March 1989. The grid collapsed in 92 seconds, leaving six million people without power for nine hours, and in the same storm a large transformer at a nuclear station in New Jersey was destroyed outright. That storm was a fraction of Carrington’s size.
Cost estimates for a Carrington-class event today are large and honestly uncertain. A widely cited 2013 study put 20 to 40 million people in the United States at risk of outages lasting from 16 days to as long as two years, with a total economic cost between $0.6 trillion and $2.6 trillion. The width of that range is not sloppiness, it is the finding. The driving assumption is the replacement time for large custom high-voltage transformers, which is 12 to 24 months with no meaningful spare inventory, and nobody knows how many would fail. And in July 2012 a comparable ejection crossed Earth’s orbit and missed by roughly a week of orbital position.
What can be done is mostly operational, and it turns on one measurement. Whether an ejection produces a severe storm depends heavily on the north-south orientation of the field embedded in it: a southward field opposes Earth’s own at the nose and reconnects efficiently, coupling energy in, and a northward field largely does not. And that orientation cannot be determined by watching the sun. It must be measured in the wind itself, which is why spacecraft sit a million and a half kilometres upstream and why the useful warning is 15 to 60 minutes rather than three days. With it, operators reduce loading and bring reserves online, and some utilities fit blocking capacitors in transformer neutrals to keep the direct current out altogether.
Section 7: What This Chapter Established
Chapter 2’s plasma frequency decides what reflects and Chapter 4’s collisions decide what is absorbed, and shortwave radio is the two working together on a daily cycle you can log with a portable receiver.
The aurora is not solar particles arriving. It is Earth’s own magnetotail snapping back and accelerating electrons down field lines, and the colours are a spectroscopic reading of altitude and species. And a magnetic field’s pressure sets the size of the magnetosphere, at a nanopascal on each side, which is Chapter 11’s formula applied to a structure bigger than the planet.
And the same physics reaches the grid. A changing field induces an electric field in the ground, the ground drives direct current through transformers designed for alternating current, and the transformer is the thing that breaks. That chain has been demonstrated twice in the historical record, and the honest position on the cost of a repeat is a range spanning a factor of four.
Next: the same charged particles, accelerated on purpose, out the back of a spacecraft. Why an engine that pushes with the weight of two sheets of paper is the correct engine, and why the corona thruster you built in Chapter 7 would not work in space at all.

Bench Degree
Get the degree without the diploma.
Learn the material, not how to pass the exam.