Bench Degree·REFRIGERATIONchapter

Chapter 13: The Pressure-Enthalpy Diagram
One chart holds the entire cycle, and once you can read it you can measure a machine’s efficiency with a ruler.
Chapter 10 walked the cycle as eight stations in a table. Chapter 12 turned two of those stations into diagnostics. This chapter puts all eight on a single sheet of paper, and the reason to bother is that once the cycle is a shape rather than a list, you can measure it.
The chart is called a pressure-enthalpy diagram, or a P-h diagram, or in the trade simply a Mollier chart. It looks intimidating on first encounter, largely because it is usually handed over finished. Built up one axis at a time it is straightforward.
Section 1: The Missing Word, Enthalpy
One new term, and only one.
Enthalpy is the total heat content of the refrigerant per
unit mass. Symbol h, measured in Btu per pound or
kilojoules per kilogram.
That is very nearly all you need. Two refinements make it precise.
It includes both sensible and latent heat. A pound of R-410A at 4 °C (40 °F) as saturated liquid has a certain enthalpy. Boil it, still at 4 °C, and its enthalpy rises by the full 75 Btu/lb (174 kJ/kg) of latent heat, while its temperature does not move at all. Enthalpy is the property that notices what a thermometer cannot see, which is exactly what Chapter 5 said was hiding.
The zero point is arbitrary. Enthalpy is always quoted relative to some reference state, usually saturated liquid at a stated temperature. That does not matter, because every useful quantity in this chapter is a difference between two enthalpies, and the arbitrary offset cancels.
IN PLAIN ENGLISH: Temperature tells you how hot the refrigerant is. Enthalpy tells you how much heat it is carrying. In a phase change the first stops moving and the second keeps climbing, which is why you need it.
Section 2: Building the Chart
Axis one, horizontal: enthalpy. Heat content per pound, increasing to the right. Move right on this chart and the refrigerant is carrying more heat.
Axis two, vertical: pressure. Increasing upward, and drawn on a logarithmic scale, because refrigeration pressures span more than a decade and a linear axis would squash the low side into nothing.
Now the shape that makes it useful.
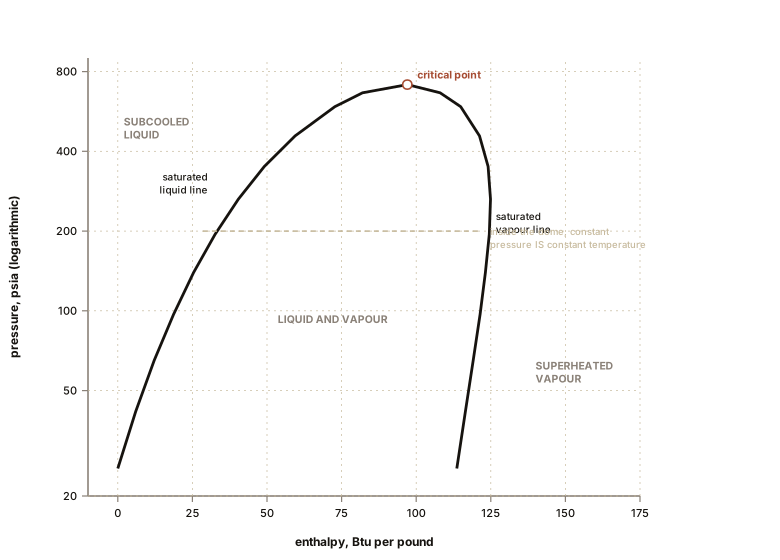
The saturation dome. Draw the saturated liquid line, which is the locus of points where the fluid is entirely liquid and about to boil. It rises up the left. Draw the saturated vapour line, the locus where it is entirely vapour and about to condense. It rises up the right. They meet at the top, at the critical point, and together they form an upside-down U.
That dome divides the chart into three regions, and they are the same three states from Chapter 7:
- Left of the dome: subcooled liquid.
- Inside the dome: a mixture of liquid and vapour, saturated, boiling or condensing.
- Right of the dome: superheated vapour.
And inside the dome, horizontal lines are constant pressure and also constant temperature, because Chapter 7 locked them together for a saturated fluid. This is why the dome’s interior is where all the interesting work happens: move horizontally across it and you are boiling or condensing at fixed temperature while enthalpy changes enormously. That horizontal traverse is Chapter 5’s plateau, drawn.
Section 3: Drawing Your Cycle On It
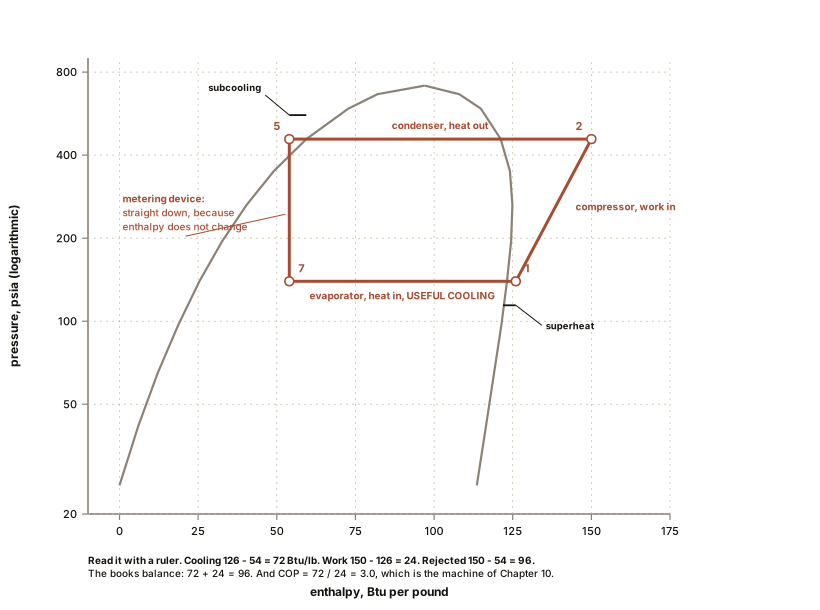
Take the eight stations of Chapter 10 and mark them. The cycle becomes four line segments, and each one is a component.
Segment A, compression. Station 1 to Station 2. From the saturated vapour side, up and to the right. Pressure rises because the compressor raised it. Enthalpy rises too, because the compressor’s work went into the refrigerant as heat. The rightward length of this segment is the work the compressor did.
Segment B, heat rejection. Station 2 to Station 5. Straight across to the left at constant pressure. First a short stretch in the superheated region, desuperheating. Then it crosses the saturated vapour line and traverses the dome, condensing at constant temperature. Then it crosses the saturated liquid line and continues a little further left, which is the subcooling. The leftward length of this whole segment is the heat rejected outdoors.
Segment C, expansion. Station 6 to Station 7. Straight down. Pressure collapses through the metering device, and enthalpy does not change, because no heat was added or removed and no work was done. The refrigerant simply redistributed its own energy, some of it flashing to vapour and chilling the rest. This is why the segment is vertical, and it is the clearest possible picture of Chapter 10 Section 5.
Segment D, heat absorption. Station 7 to Station 1. Straight across to the right at constant pressure, through the dome, boiling at constant temperature, exiting slightly past the saturated vapour line into superheat. The rightward length of this segment is the useful cooling.
Four segments. A rough rectangle with a slanted left side, sitting across the dome.
And now the two diagnostics of Chapter 12 are visible as geometry. Superheat is how far segment D pokes past the right-hand branch of the dome. Subcooling is how far segment B pokes past the left-hand branch. Zero superheat means segment D stops exactly on the dome, and a technician looking at the chart can see the liquid about to reach the compressor.
Section 4: Reading Efficiency Off the Page
Here is the payoff. Every quantity worth knowing is a horizontal distance.
Using representative R-410A enthalpies for the Chapter 10 cycle, in Btu/lb:
| Station | Enthalpy |
|---|---|
| 1, compressor inlet | 126 |
| 2, compressor outlet | 150 |
| 5, condenser outlet | 54 |
| 7, evaporator inlet | 54 |
Useful cooling per pound, segment D:
h₁ − h₇ = 126 − 54 = 72 Btu/lb
Compressor work per pound, segment A:
h₂ − h₁ = 150 − 126 = 24 Btu/lb
Heat rejected per pound, segment B:
h₂ − h₅ = 150 − 54 = 96 Btu/lb
Check the books balance: 72 + 24 = 96. Heat in
plus work in equals heat out. If your arithmetic does not
close, you have made an error, and this check catches it every time.
Coefficient of performance:
COP = useful cooling / work in = 72 / 24 = 3.0
That is the whole calculation. Two subtractions and a division, read off a chart with a ruler.
Notice that stations 5 and 7 have the same enthalpy, 54, which is segment C being vertical. That is not an approximation; it is what “constant enthalpy” means, and it is why the metering device appears on this chart as a line with no length in the useful direction.
SLOW DOWN. Check Your Understanding: A cycle has
h₁ = 124,h₂ = 154,h₅ = 56Btu/lb. What is the COP, and what is the heat rejected per pound? Work it out before reading on.Cooling is
124 − 56 = 68. Work is154 − 124 = 30. COP = 68 / 30 = 2.3. Heat rejected is154 − 56 = 98, and the check holds:68 + 30 = 98. Note this machine is worse than the previous one, and the chart shows why at a glance: the compression segment is longer, meaning it is working across a larger pressure lift for the same cooling.
Section 5: What Makes the Shape Better or Worse
The chart makes something visible that a table cannot: why efficiency changes.
Raise the condensing pressure and the top of the rectangle moves up. Segment A lengthens because the compressor must work across a bigger lift, while segment D barely changes. Work up, cooling flat, COP falls. That is what a dirty condenser coil or a failed fan does, and it is why Chapter 12’s high subcooling and high head pressure matter economically as well as mechanically.
Lower the evaporating pressure and the bottom moves down. Same effect: more lift, more work, COP falls. That is what a blocked filter or an iced coil does.
Add subcooling and station 5 moves further left, which drags station 7 left with it, which lengthens segment D. More useful cooling for the same work. COP rises. This is the chart proving Chapter 10’s claim that every degree of subcooling buys capacity.
Add superheat at the evaporator and station 1 moves right, lengthening segment D, which looks like a gain. It is mostly not, because that superheat was picked up from the suction line rather than from the room, and it also makes the compressor work harder on a hotter, less dense vapour. Superheat is a safety margin, not an efficiency strategy.
IN PLAIN ENGLISH: Anything that increases the pressure difference the compressor must work across makes the machine less efficient. Anything that gets more cooling out of the same pass round the loop makes it more efficient. The chart shows both as changes in the shape of a rectangle.
Section 6: The Ceiling
There is a maximum COP no machine can beat, and it comes from the absolute temperatures of Chapter 4:
COP(max) = T(cold) / (T(hot) − T(cold))both in kelvin or Rankine. For our cycle, cold coil at 4 °C / 40 °F (277 K) and hot coil at 49 °C / 120 °F (322 K):
COP(max) = 277 / (322 − 277) = 277 / 45 = 6.2
Our real machine managed 3.0 against an ideal 6.2, which is about 48 percent of the theoretical limit. That is genuinely good, and it is worth knowing that vapour-compression refrigeration is one of the more thermodynamically efficient machines humans build, far better than an internal combustion engine at around 30 percent of its own ceiling.
And notice what governs the ceiling: only the two temperatures. Not the refrigerant, not the compressor, not the money spent. Bring the two coil temperatures closer together and the ceiling rises for everyone. Which is why Chapter 19’s heat pump gets dramatically worse in bitter weather, and why a ground-source machine beats an air-source one: it is working across a smaller gap.
Section 7: COP, EER, SEER, and Which Numbers Lie
Four efficiency figures, and they are not interchangeable.
COP is dimensionless: heat moved divided by energy in, both in the same units. Our machine’s 3.0. Honest, and always specific to one operating condition, so always ask at what temperatures.
EER, the Energy Efficiency Ratio, is the same thing in mixed units: Btu/h of cooling per watt of electricity, at one fixed test condition of 35 °C (95 °F) outdoors and 27 °C (80 °F) indoors. Because Btu/h and watts differ by 3.412:
EER = COP × 3.412So our COP of 3.0 is an EER of 10.2.
SEER, the Seasonal Energy Efficiency Ratio, attempts to roll a whole cooling season into one figure, including part-load operation and cycling losses. It is always higher than EER for the same machine, because much of a season is milder than the EER test condition.
SEER2 replaced SEER in the United States in 2023, using a higher external static pressure in the test to reflect real ductwork. SEER2 numbers are roughly 4.5 to 5 percent lower than SEER for the same machine, which caused a great deal of confusion when equipment appeared to get worse overnight. It did not; the test got more honest.
And the warning, which matters practically. A SEER2 of 18 does not mean your bill will reflect an EER of 18. The seasonal figure assumes a particular climate profile, a correctly sized machine, correct charge and clean coils. A machine with 20 percent low airflow and a dirty condenser will not deliver its rating, and the Chapter 12 diagnostics are how you find out whether it can.
ON THE BENCH: Plot your own cycle and compute its COP
Parts: the measurements from Chapter 12; a printed P-h chart for your refrigerant, free from any manufacturer; a ruler and a pencil. Cost: nothing. Time: 45 minutes. Method: from your two pressures, draw the two horizontal lines. From your suction line temperature, find station 1 where that temperature crosses the low-pressure line in the superheated region. From your liquid line temperature, find station 5 similarly in the subcooled region. Drop station 5 straight down to the low-pressure line to get station 7. Read the three enthalpies. Then compute cooling, work and rejection, check that they balance, and compute COP. Then compute the Carnot ceiling from your two saturation temperatures in kelvin and see what fraction of it your machine achieves. What you should get: something between 45 and 65 percent of the ideal on a healthy machine. You have just measured the thermodynamic efficiency of a real machine with a ruler, and you can now do it for any machine you can get gauges onto.
Section 8: What This Chapter Bought You
Enthalpy is heat content, and it is the property that sees what a thermometer cannot.
The cycle is four segments on one chart: a slanted compression, a horizontal rejection, a vertical expansion, a horizontal absorption.
Every useful quantity is a horizontal distance, and
cooling + work = rejection is a check that catches
arithmetic errors every time.
Superheat and subcooling are visible as geometry, which is a better way to hold them than as two definitions.
Efficiency is governed by the gap between the two coil temperatures, and anything that widens that gap costs money, which is the economic argument for clean coils stated as thermodynamics.
And the marketing number is not the number you will get. SEER2 assumes correct sizing, correct charge, clean coils and a particular climate. Chapter 12 is how you find out which of those assumptions your machine is failing.
Next, Chapter 14 deals with the other thing an air conditioner does, which is remove water from the air, and with the fact that most of the confusion about comfort cooling lives in the difference between cooling air and drying it.

Bench Degree
Get the degree without the diploma.
Learn the material, not how to pass the exam.