Bench Degree·SOLAR POWERchapter

Chapter 14: Degradation and Failure
A twenty-five year warranty is not a promise that the panel will work for twenty-five years. It is a promise about a number, and collecting on it requires a measurement almost nobody made on the day the array was switched on.
The single most useful diagnostic tool for a solar array costs about $300 and clips onto a phone.
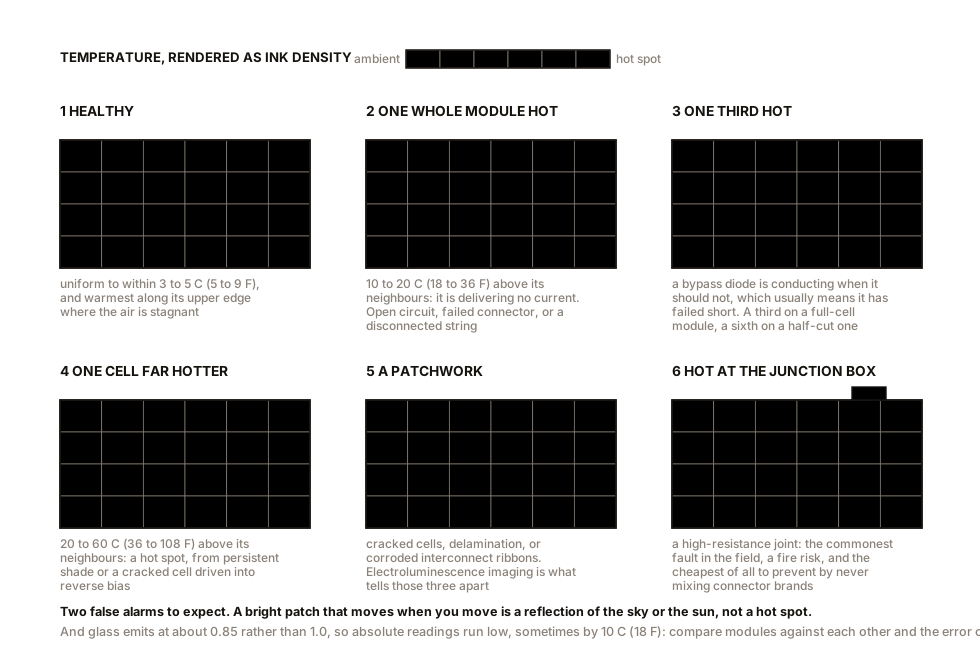
A thermal camera makes a working array legible in a way that no meter does, because almost every failure mode of a photovoltaic module ends up as a temperature anomaly. Energy that is not leaving as electricity is leaving as heat, and heat is exactly what a thermal camera sees.
Point one at a healthy array in full sun and you get a boring picture: every module the same, uniform to within a couple of degrees, perhaps a slight warmth at the top of each panel where the air is stagnant.
Point one at a faulty array and the fault is usually obvious in a single frame.
| What you see | What it means |
|---|---|
| One whole module uniformly hotter, by 10 to 20 °C (18 to 36 °F) | the module is not delivering current: an open circuit, a failed connector, or a disconnected string |
| One third or one sixth of a module hotter | a bypass diode is conducting when it should not be, which usually means it has failed short |
| One single cell far hotter, 20 to 60 °C (36 to 108 °F) above its neighbours | a hot spot, from persistent shade or a cracked cell in reverse bias |
| A patchwork of warm and cool cells within one module | cracked cells, delamination, or corroded interconnect ribbons |
| A hot spot exactly at a connector or junction box | a high-resistance joint, which is a fire risk and the commonest fault of all |
That table is most of field diagnostics. The rest of this chapter is why each of those things happens, and what a warranty will and will not do about it.
ON THE BENCH: Thermal-image a working array
Parts: a thermal camera. A phone-attachment unit is about $300; a cheap standalone imager about $150 and considerably worse; borrowing one from a building surveyor or an electrician is free. Cost: $0 to $300. Time: an hour, on a clear day. Hazards: if the array is on a roof, image it from the ground with a long lens or from an upstairs window. Do not climb onto a roof for a photograph. Nothing in this box requires you to touch the array. Method: work with irradiance above about 600 W/m², which means the middle of a clear day, and with the array under load and generating, because an idle array shows nothing. Image every module. Then image the junction boxes and the visible connectors, which is where the most consequential faults live. What you should see: uniformity. On a healthy array all modules should agree within 3 to 5 °C (5 to 9 °F), with the warmest part of each module near its upper edge. The two false alarms to expect. First, reflections: photovoltaic glass reflects the sky, and it reflects the sun. A bright patch that moves when you move is a reflection, not a hot spot. Move and look again. Second, emissivity: glass emits at about 0.85 rather than 1.0, so absolute temperatures read low, sometimes by 10 °C (18 °F) or more. Compare modules against each other rather than trusting the numbers, and the emissivity error cancels. What to do with a finding: photograph it, note the date, time, irradiance and which module by position, and repeat in a month. A single image is a suspicion. Two images a month apart, showing the same anomaly, is evidence, and evidence is what a warranty claim needs.
Section 1: Degradation, and What the Warranty Actually Says
A silicon module loses output slowly and steadily for its whole life. The consensus figure, from a large body of field data, is a median of about 0.5 percent per year, with a mean nearer 0.8 percent because a minority of badly behaved modules drags the average up.
Compound that over the warranted life:
0.995 ^ 25 = 0.882
About 88 percent of original output at year 25, which is why modern performance warranties are written at figures like “not less than 87.4 percent at year 25”. The warranty is calibrated to the observed degradation rate with very little margin, which is worth noticing.
There are two warranties on every module and they cover different things.
The product warranty covers manufacturing defects, and it runs 12 to 25 years depending on the manufacturer. This is the one that replaces a module with delamination, a cracked backsheet or a failed junction box.
The performance warranty covers output, and it runs 25 or 30 years. It promises a percentage, prorated, and here is what it actually requires of you: you must demonstrate that the module’s output has fallen below the warranted curve. Which means measuring a module’s power under known irradiance and temperature, correcting to standard test conditions, and comparing against a figure for that module when new.
Almost nobody has the original measurement. The nameplate is not a measurement of your module; it is a bin classification with a tolerance, often stated as zero to plus five watts. So the reference point against which a claim would be judged is itself approximate.
And the remedy is usually the shortfall, prorated, in modules or money, and never the cost of a crew to come and swap them.
None of this makes the warranty worthless. It makes it a specific and limited instrument, and the practical response is cheap: measure your array properly in its first month, on a clear day, and write the numbers down. Per-string current and voltage, irradiance, module temperature, time and date. That single page of paper is the reference measurement, it costs an afternoon, and without it a performance claim in year eighteen is an argument you will lose.
IN PLAIN ENGLISH: Solar panels do not stop working one day; they fade, by about half a percent a year, so after twenty-five years they produce roughly a ninth less than when new. The warranty promises that fade rate and nothing more. To claim on it you have to prove your panels are worse than promised, which requires knowing what they did when they were new, which is a measurement you have to make yourself in the first few weeks. Nobody tells you that at the point of sale, and it takes one afternoon.
Section 2: The First Year Is Different
Two things happen early and neither is a fault.
Light-induced degradation is an initial drop of 1 to 3 percent within the first hours to days of exposure, caused by boron and oxygen in the silicon forming complexes that trap carriers. It is expected, it is included in the manufacturer’s warranted curve, and it is part of why Chapter 13’s derate chain has a 0.985 term.
Light and elevated temperature induced degradation, known by the acronym LeTID, is a slower and larger version that afflicted some PERC modules particularly: several percent over one to three years, sometimes partially recovering afterwards. It was a real industry problem in the late 2010s and modern processing largely addresses it, but it is a good illustration of a general point. A degradation rate measured on ten-year-old modules does not necessarily apply to modules made with a process introduced last year, and the honest position on any new cell technology is that its twenty-five year behaviour is unknown because twenty-five years have not passed.
Section 3: Potential-Induced Degradation
This one is worth its own section because it is the most severe non-obvious failure mode, and because understanding it explains a design detail you will see on every array.
Chapter 10 established that arrays run at several hundred volts. That voltage exists between the cells and the module’s frame, which is earthed, and it is present all day, every day, for twenty-five years.
Under that standing voltage, in humid conditions, sodium ions migrate out of the glass, through the encapsulant, and onto the cell surface, where they create leakage paths that shunt the junction. The cell’s fill factor collapses first, then its voltage.
The losses are large. Up to 30 percent, and it develops over months to years, most severely on the modules at the negative end of a string, because they sit at the largest negative potential relative to earth.
Three things about it are worth knowing.
It is a system-level fault with a module-level symptom. The same modules on a different array, or grounded differently, would be fine. A thermal image shows nothing unusual, because the loss is in voltage rather than in dissipation.
It is partially reversible. Applying a positive bias to the array overnight can drive the sodium back, and some inverters do this automatically as a standard feature. A module that has been recovered this way will degrade again if the underlying cause is not addressed.
And it has largely been designed out, by better encapsulants, higher-resistivity glass, and grounding schemes that keep the array’s negative terminal at or above earth potential. Modules are now tested against IEC 62804 for resistance to it. If you are looking at an array installed before about 2013, in a humid climate, with a large unexplained loss concentrated at one end of a string, this is the first thing to suspect.
Section 4: The Rest of the Catalogue
Cell cracking is the most widespread damage and the least visible. Silicon wafers are about 0.15 mm (0.006 in) thick, which is thinner than a business card, and they crack from hail, from thermal cycling, from rough transport, and above all from people standing on modules during installation. A cracked cell often works perfectly at first, because the crack has not yet separated, and then degrades over years as thermal cycling opens it. The definitive test is electroluminescence imaging, which runs current backwards through the module in the dark and photographs the faint infrared glow, with cracks appearing as dark lines. It needs a power supply, a modified camera and a dark night, and it is within reach of a determined amateur.
Snail trails are thin discoloured lines that appear on a module’s surface after a few years, following the path of an underlying microcrack. They are silver from the front metallisation reacting with the encapsulant and migrating along the crack. The trail itself is cosmetic. What it marks is not, and a module developing snail trails is telling you it has cracked cells.
Backsheet failure is the industry’s most expensive recent lesson. Certain polyamide backsheets used in modules manufactured roughly between 2010 and 2013 crack transversely after a few years of ultraviolet exposure, exposing the cell circuit to moisture and eventually producing ground faults and insulation failures. It affected a defined set of product families, it triggered large warranty claims, and it is the clearest example of the general rule that a twenty-five year product cannot be validated in a two-year accelerated test. The failures were not predicted by the qualification standards of the time, and the standards were changed as a result.
Delamination is the loss of adhesion between glass, encapsulant, cells and backsheet. It shows as visible cloudiness or bubbling, it admits moisture, and it is progressive and terminal for the module.
Bypass diode failure matters more than its size suggests. A diode can fail two ways.
Failed short is the more common. The diode conducts permanently, so its group of cells is bypassed all the time, and the module loses a third or a sixth of its output forever. On a thermal image the bypassed group runs hot. The symptom is a module producing about two thirds of its neighbours’ output, on a clear day, with no shade anywhere.
Failed open is more dangerous, because it removes the protection without changing anything visible. The module produces full output and looks perfect, until the day a leaf lands on it and Chapter 9’s 96 W of reverse dissipation lands in one cell with nothing to divert it.
Connectors are the commonest fault in the field. MC4-pattern connectors from different manufacturers frequently mate mechanically while making a poor electrical contact, because the tolerances of the internal spring contacts differ between brands. A high-resistance joint heats up, oxidises, gets worse, and eventually arcs. Water ingress and galvanic corrosion do the same job more slowly.
Say something honest about the frequency. Various field studies put connector and junction-box faults at the top of the list of photovoltaic failures and of photovoltaic-related fires, but the numbers differ substantially between studies, and much of the underlying data is held by installers and insurers rather than published. So the ranking is well supported and the percentages are not. What is not contested is the remedy, and it costs nothing: never mix connector brands, crimp with the correct tool rather than pliers, and image the connectors thermally once a year.
And the inverter is the shortest-lived major component. Expect a replacement at 10 to 15 years, and budget for it, as Chapter 13’s economics did.
Section 5: Finding the Bad Panel in a String of Twenty
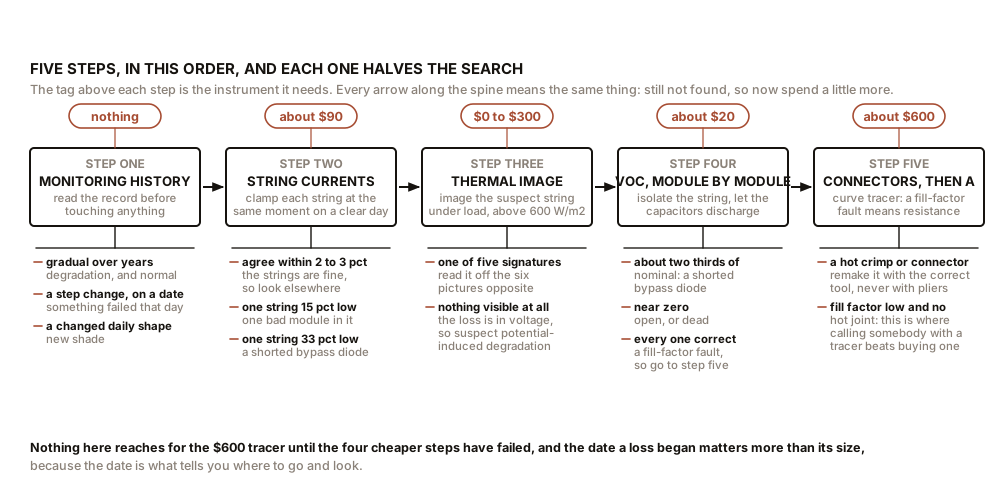
A procedure, in order of cost, and each step narrows the search.
Step one: compare the system with itself. Look at the monitoring history. A gradual decline over years is degradation. A step change on a specific date is a component failure or new shade. A daily pattern that has changed shape is shading. The date matters more than the magnitude, because it tells you what to go and look at.
Step two: compare the strings. With a DC clamp meter, read the current in each string at the same moment on a clear day. Two strings of eight identical modules should agree within 2 to 3 percent. A string reading 15 percent low has one bad module in it; a string reading 33 percent low has a shorted bypass diode. This is a two-minute measurement and it halves the problem.
Step three: thermal-image the suspect string, by the first bench box. Most faults are now visible.
Step four: measure module by module. Isolate the string, wait for the inverter’s capacitors to discharge, then measure each module’s open-circuit voltage individually. A healthy module reads 38.8 V at 25 °C (77 °F) and rather less when hot; use the temperature correction from Chapter 9. A module reading about two thirds of its neighbours has a shorted bypass diode. A module reading near zero is open or dead. Then short-circuit current, module by module, which will find a module that is dirty, shaded or delaminated rather than electrically faulty.
Step five, if you still have not found it: the fault is a fill-factor problem, which means resistance, which means a joint. Go back to the connectors with the thermal camera under maximum load, and check the crimps. A curve tracer, from about $600, measures fill factor directly and will find it in one sweep, and this is the point at which calling a professional with one is cheaper than buying one.
ON THE BENCH: Have somebody break it, then find the fault
Parts: three or four small panels from Chapter 10, about $18 each; a rheostat as a load; a DC clamp meter, about $90, or an ammeter; a multimeter; a thermal camera if you have one; a card; a 0.5 Ω power resistor; a length of wire; and one accomplice. Cost: about $90 beyond earlier boxes. Time: an afternoon. Hazards: four panels in series reach 88 V. Rewire only with the panels covered. Method: wire the panels in series into the load and record the healthy baseline: string current, string voltage, each module’s voltage, and a thermal image if you have one. Then leave. Your accomplice introduces exactly one of the following, without telling you which: 1. A 0.5 Ω resistor spliced into one interconnection, simulating a corroded joint. 2. A wire shorting one module out entirely, simulating a bypass diode failed short. 3. A card covering one cell of one module, simulating shade or a cracked cell. 4. One module’s connection reversed, which is a real and common installation error. 5. Nothing at all. Your job: identify which, using only the procedure in Section 5, and say which measurement told you. What you should find: the shorted module drops string voltage by a quarter with the current almost unchanged. The series resistor barely changes voltage or current at low output and costs increasingly at high current, so it is invisible in the morning and obvious at noon. The shaded cell collapses the current, not the voltage. The reversed module drops the string voltage by half a module’s worth twice over, once for the missing contribution and once for the opposing one. Why the fifth option matters: an accomplice who does nothing tests whether you will find a fault that is not there. Every field technician has replaced a healthy component, and the discipline that prevents it is having a baseline measurement and trusting it. Which is exactly the argument of Section 1.
SLOW DOWN. Check Your Understanding: An array in year eight is producing 12 percent less than it did in year one, on comparable clear days at the same time of year. The owner assumes degradation and considers claiming on the performance warranty. From the expected degradation rate, is 12 percent in eight years plausible? And what should be checked before anyone writes to a manufacturer? Answer before reading on.
It is not plausible as degradation, and the sums say so immediately. At 0.5 percent a year, eight years costs
0.995^8 = 0.961, about 4 percent. Even at the pessimistic 0.8 percent a year it is 6 percent. Twelve percent in eight years is two to three times any defensible degradation rate, so something else is happening and the warranty is almost certainly not the route to a remedy.Check these first, in this order, because they are free and they are usually the answer.
Trees grow. Eight years is enough for a sapling to become a shading problem, and the loss appears gradually, which is exactly what degradation looks like on an annual chart. Compare the shape of a summer day now against the shape eight years ago, not the totals: shading changes the shape and degradation does not.
Soiling accumulates. Eight years of dust, pollen, lichen at the module’s lower edge where water sits, and bird droppings. This is worth 2 to 8 percent and a hose fixes it.
The inverter may be derating. A fan clogged with dust, or a unit installed in a hot cupboard, will reduce output on precisely the hottest, sunniest days.
And one connector may be adding resistance. A single degraded joint carrying string current can cost several percent and shows nothing except a fill factor nobody measured.
The general lesson is the one worth keeping. Degradation is slow, small and boring, and it is blamed for almost everything. A loss larger than about half a percent a year is not degradation; it is a fault, and faults have causes you can find and usually fix for nothing. Suspect the tree before the physics.
Chapter 15 closes the ledger: what the first chapter promised, what has been delivered, and what this book left out.

Bench Degree
Get the degree without the diploma.
Learn the material, not how to pass the exam.