Bench Degree·SOLAR POWERchapter

Chapter 4: Photons, Energy and Wavelength
Chapter 1 gave you two LEDs in the same sunlight reading different voltages. That was not a defect in either of them. It was a measurement of the energy carried by a single particle of light, taken on a driveway with a twenty dollar meter.
Hold a CD or a DVD at arm’s length in sunlight and tilt it until a band of colour appears across the shiny side.
That band is the sunlight taken apart. The disc has a spiral of pits about 1,600 nm apart on a CD and 740 nm on a DVD, and that spacing is close enough to the wavelength of visible light to split it by colour. A DVD, with its finer spiral, spreads the colours further apart than a CD does.
Look at what the band actually contains. Red at one end, violet at the other, and everything between, with no gaps and no steps. Then notice what you cannot see: the band does not stop where your eye stops. Beyond the violet there is ultraviolet, and beyond the red there is infrared, and there is a great deal of infrared.
More than half the energy in sunlight is in light you cannot see. That fact decides the ceiling on every solar cell ever built, and Chapter 8 spends a whole chapter on it.
ON THE BENCH: Split the sun with a disc, then let the cell tell you what it sees
Parts: a CD and a DVD; a small solar cell, 0.5 to 2 W, about $5, or the panel from Chapter 1; a multimeter; a cardboard box; a craft knife. Cost: about $5 if you own the meter. Time: 45 minutes. Hazards: never look at the sun through anything. Point the disc so the spread band falls on a wall or a card, and look at the card. Method: cut a slot about 1 mm (0.04 in) wide and 40 mm (1.6 in) long in one side of the box. Tape the disc inside at roughly 45 degrees. Aim the slot at the sun and find the spread band on the inside of the box. Widen the viewing hole until you can see the whole band at once. Then measure it. Cut a second hole, put the solar cell behind it on a slide of card, and move it along the band while watching the short-circuit current on the meter. Note the current at red, at green, at blue, and at the point past the red end where your eye says there is nothing. What you should see: current at every colour, and current past the red end where you see nothing at all. The cell responds to light that is invisible to you, and on a silicon cell that invisible region carries a substantial share of the total. If the band is faint: narrow the slot and work in a darker room with only the sunbeam entering. A DVD gives a wider, dimmer band; a CD gives a narrower, brighter one.
Section 1: One Equation, and Its Useful Form
The energy carried by a single photon is set by its wavelength:
E = hc / λwhere h is Planck’s constant, c is the speed of light, and λ is the wavelength. That is Einstein’s 1905 proposal from Chapter 3, written out.
In that form it is awkward, because h is 6.626 x 10⁻³⁴ and the answers come out as tiny fractions of a joule. So nobody working in this field uses it that way. Multiply hc out in the units you actually want and you get a number worth memorising:
E (in electron volts) = 1,240 / λ (in nanometres)One constant, one division, and you can compute the energy of any photon in your head. The electron volt is simply the energy an electron picks up crossing a one volt potential difference, which makes it exactly the right unit here, because the voltage a cell produces and the energy of the photons arriving are then the same kind of number.
Work the visible spectrum:
| Colour | Wavelength (nm) | Photon energy (eV) |
|---|---|---|
| Ultraviolet | 350 | 3.54 |
| Violet | 400 | 3.10 |
| Blue | 450 | 2.76 |
| Green | 550 | 2.25 |
| Yellow | 580 | 2.14 |
| Red | 650 | 1.91 |
| Deep red | 700 | 1.77 |
| Near infrared | 940 | 1.32 |
| Silicon’s cutoff | 1,107 | 1.12 |
| Mid infrared | 2,000 | 0.62 |
A blue photon carries about 45 percent more energy than a red one. That is the entire content of the two-LED result from Chapter 1, and you can now check it: the blue LED read higher because the photons striking it were individually more energetic, and Chapter 6 will show exactly how the energy of a photon sets the voltage a junction can develop.
IN PLAIN ENGLISH: Light comes in lumps. Blue lumps are big, red lumps are small, infrared lumps are smaller still. Turning a lamp up brighter sends more lumps, not bigger ones. That single distinction, between how many and how big, is the one you have to keep hold of, because a solar cell cares about both and it cares about them in completely different ways.
Section 2: The Last Row of That Table Is the Important One
Silicon’s cutoff at 1,107 nm is not a property of light. It is a property of silicon, and Chapter 5 explains where it comes from. What matters here is what it does.
A photon carrying less than 1.12 eV passes through a silicon solar cell and is not converted. Not converted inefficiently. Not converted partially. It either passes through, or it is absorbed as plain heat, and either way it contributes no electricity.
That is a hard edge at a specific colour, and it is worth seeing for yourself, which is what the second bench box does.
ON THE BENCH: Find the edge with a television remote
Parts: any infrared remote control; a solar cell of 0.5 W or more; a multimeter on its most sensitive DC millivolt or microamp range; a phone camera. Cost: nothing. Time: 15 minutes. Hazards: none. Method: work in a dark room so the cell is producing nothing. Press a button on the remote with its LED touching the cell’s surface. Watch the meter. What you should see: a clear reading, tens of millivolts open circuit, from a light source your eye insists is off. Most remotes emit at 940 nm, which the table above says carries 1.32 eV, comfortably above silicon’s 1.12 eV threshold. The cell converts it because it is a big enough lump, and your eye cannot see it because your eye’s own threshold sits near 700 nm. Then confirm it is really light: point the phone camera at the remote and press a button. Most phone cameras see 940 nm as a pale violet flicker, because a silicon image sensor has the same 1.12 eV threshold that your solar cell does. Better, if you have one: an old remote or an IR illuminator at 1,300 or 1,550 nm, sold for fibre-optic work. Those wavelengths carry 0.95 and 0.80 eV, both below silicon’s cutoff, and the cell will read nothing at all while a germanium photodiode reads them easily. That is the cleanest demonstration of a band gap you can do at a bench, and it is a matter of one number in one column of one table.
Section 3: Where the Sun’s Energy Actually Sits
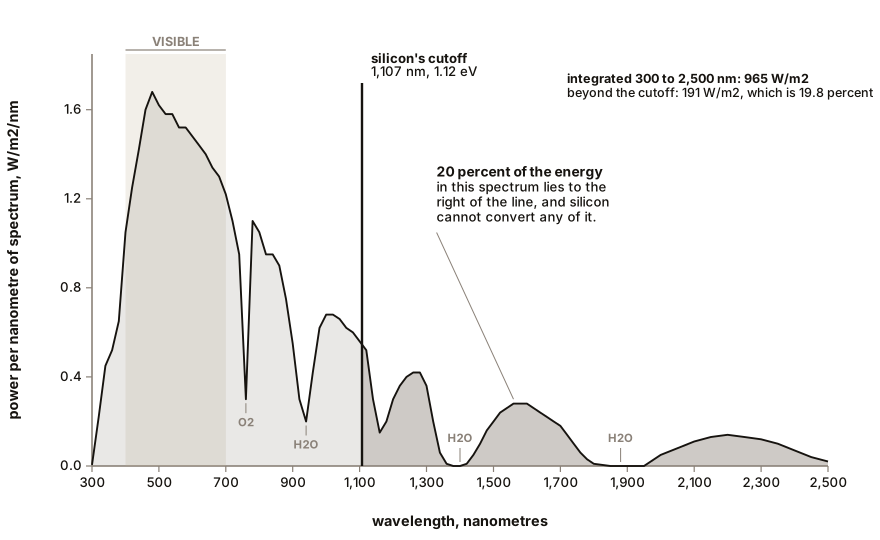
The spectrum you saw on the box wall is not evenly loaded. Roughly, and the exact split depends on the atmosphere on the day:
| Region | Wavelengths (nm) | Share of the energy |
|---|---|---|
| Ultraviolet | below 400 | about 4 percent |
| Visible | 400 to 700 | about 43 percent |
| Infrared | above 700 | about 53 percent |
The peak, measured as power per unit wavelength, sits around 500 nm, in the blue-green. Which is a pleasing fact: the sun is brightest, per unit of spectrum, right in the middle of where the human eye is most sensitive, and there is nothing coincidental about that at all.
Now the number that matters for silicon. Sunlight beyond 1,107 nm carries about 19 to 20 percent of the total energy, and silicon cannot touch any of it. That loss is fixed before the cell is manufactured, before the wafer is cut, before anything is engineered. It is in the spectrum.
Section 4: Counting Photons, and Predicting a Current
Here is the calculation that justifies this whole chapter, because it takes a number from a spectrum table and predicts, correctly, what a real cell will do.
A cell’s short-circuit current is set by how many photons it converts, one electron per photon, and nothing else. So count the photons.
Standard test sunlight delivers 1,000 W/m². The average photon in
that spectrum carries a bit under 1.4 eV once the long infrared tail is
included, which is 2.2 x 10⁻¹⁹ joules, so the total arrival
rate is about:
1,000 / 2.2 x 10⁻¹⁹ = 4.5 x 10²¹ photons per square metre per second
Of those, the ones above silicon’s 1.12 eV threshold number about
2.7 x 10²¹ per square metre per second. Give each one an
electron, and each electron carries 1.602 x 10⁻¹⁹
coulombs:
2.7 x 10²¹ x 1.602 x 10⁻¹⁹ = 432 amperes per square metre
which, in the units the industry actually uses, is
43 mA/cm².
That is a prediction, and it is a good one. The best silicon cells ever made measure about 42 mA of short-circuit current per square centimetre. The ceiling set by counting photons is 43, and manufacturing has arrived within a couple of percent of it and cannot go further, because there are no more photons.
Check it against a real part. A cell in the 440 W module of Chapter 13 measures 182 mm square (7.2 in square) before it is cut in half. At 42 mA for every square centimetre of it, that is 13.9 A, and the module’s nameplate short-circuit current is 14.3 A across two parallel groups of half-cells, which is 7.15 A each from a half-cell of 182 by 91 mm (7.2 by 3.6 in).
The nameplate matches a photon count. That is not a coincidence and it is not curve-fitting. It is the reason short-circuit current is the most predictable number on a datasheet, and Chapter 7 uses that predictability constantly.
Section 5: Air Mass, and Why 8 a.m. Is a Different Sun
The spectrum above the atmosphere is not the spectrum at the ground, because the air removes some colours much more heavily than others. Ozone eats ultraviolet, water vapour cuts deep notches in the infrared, and scattering by air molecules removes blue preferentially, which is why the sky is blue and the low sun is red.
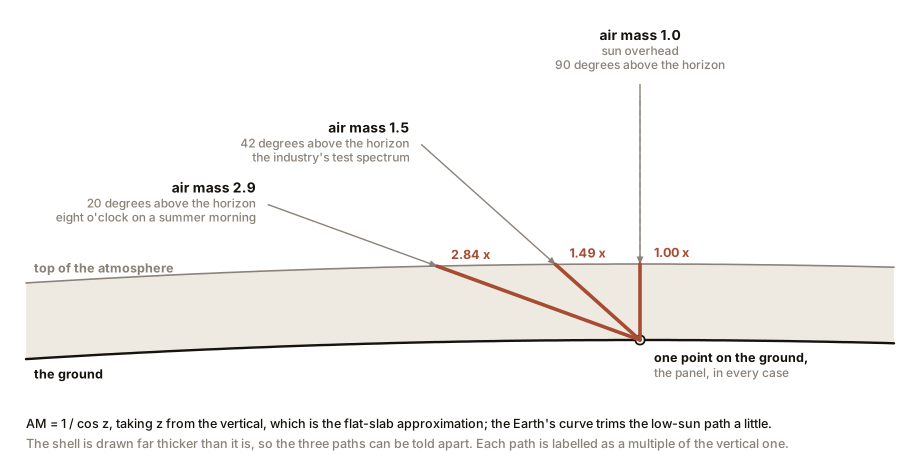
How much air the light has passed through is quantified as air mass. Straight overhead, at sea level, is air mass 1. At any other angle it is roughly:
AM = 1 / cos(z)where z is the sun’s angle away from vertical.
| Sun’s elevation above the horizon | Air mass |
|---|---|
| 90 degrees, overhead | 1.0 |
| 60 degrees | 1.15 |
| 41.8 degrees | 1.5 |
| 30 degrees | 2.0 |
| 20 degrees | 2.9 |
| 10 degrees | 5.6 |
| 5 degrees | 11.5 |
The industry’s standard test spectrum is AM1.5, which corresponds to the sun about 42 degrees above the horizon. It was chosen as a reasonable average for the mid-latitudes, not because it is common. Along with 1,000 W/m² of intensity and a cell temperature of 25 °C (77 °F), it makes up Standard Test Conditions, the laboratory recipe against which every nameplate in this book was measured.
Two consequences.
Morning and evening light is redder as well as weaker. At 8 a.m. in summer the sun might be 20 degrees up, so air mass 2.9, and the light reaching the panel has lost a disproportionate share of its blue. A cell tuned for AM1.5 is slightly mismatched to it. This is a small effect next to the plain loss of intensity, but it is real and it is measurable.
And the standard test conditions almost never happen outdoors. Getting 1,000 W/m² requires a clear day near noon. Getting a cell temperature of 25 °C (77 °F) at the same moment requires an air temperature near freezing. A panel almost never sees the conditions its nameplate describes, which is why Chapter 13 exists and why the nameplate is a starting point for a calculation rather than a promise about output.
SLOW DOWN. Check Your Understanding: A manufacturer offers two cells with different band gaps. Cell A has a gap of 1.12 eV, like silicon, and Cell B a gap of 1.9 eV, roughly matched to red light. Cell B therefore ignores everything from the red end downward, which is more than half the sun’s energy. Yet Cell B produces a substantially higher voltage per cell than Cell A. If you wanted the most power from one square metre of roof, which would you choose, and what does your reasoning tell you about the shape of the trade? Answer before reading on.
Silicon, and by a wide margin, but the reasoning is the interesting part. Cell B collects far fewer photons and gets more voltage out of each one; Cell A collects far more photons and gets less voltage out of each. Power is voltage times current, so the two effects fight, and the winner depends on where the sun’s energy actually sits.
Run the extremes. A gap of 0.1 eV would convert nearly every photon in sunlight and produce almost no voltage from any of them. A gap of 3.5 eV would produce large voltages from the 4 percent of the spectrum that is ultraviolet and would ignore the other 96 percent. Both ends give nearly zero power, so there is a best gap somewhere in the middle, and it turns out to be about 1.34 eV for a single cell in this spectrum. Silicon at 1.12 eV is slightly below the optimum and close enough that nothing else has displaced it.
Notice what you have just derived. Not a fact about manufacturing, but a ceiling, set by the shape of the solar spectrum and the arithmetic of trading photon count against photon energy. That ceiling has a name and a number, and Chapter 8 is about it.
Chapter 5 goes inside the material and asks what a band gap actually is, starting from a thermistor and a length of copper wire.

Bench Degree
Get the degree without the diploma.
Learn the material, not how to pass the exam.