Bench Degree·WIND POWERchapter

Chapter 17: How Turbines Break
The component that fails most often is not the one that costs most, and the failure that has bankrupted the most wind projects is not mechanical at all. It happened in a spreadsheet, three years before the concrete was poured.
Chapter 16’s economics assumed the machine runs for twenty to twenty-five years. This chapter is about whether that assumption survives, and it is the chapter that decides whether any of the previous twelve mattered.
The physics is already in your hands. Chapter 9 gave the tenth-power fatigue rule. Chapter 11 gave the load path and the joints in it. Chapter 14 gave the loads at rated and at cut-out. What remains is to point them at the parts that break, in the order that costs money.
Section 1: Two Rankings, Which Are Almost Reversed
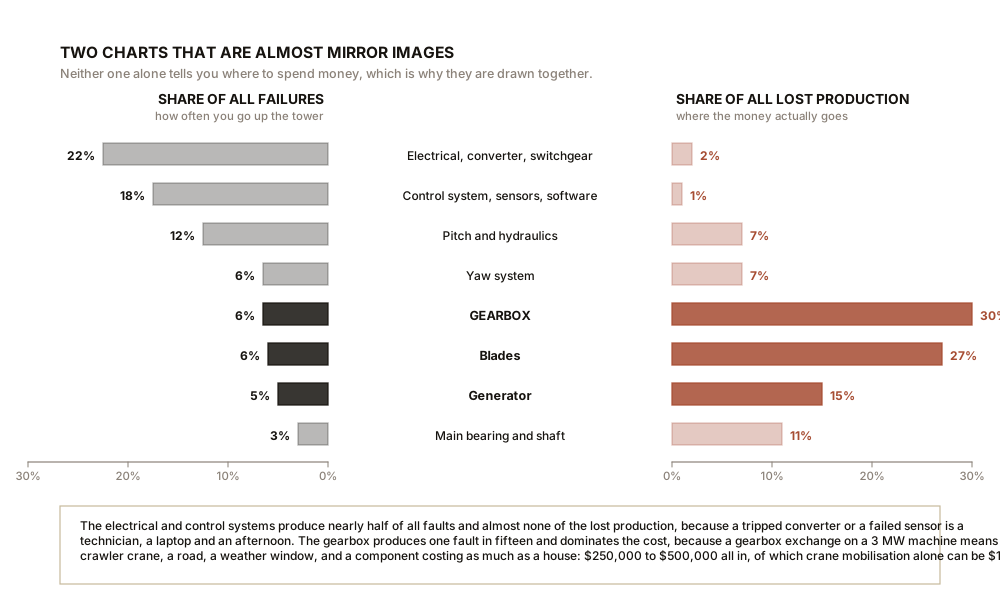
The single most useful thing to know about turbine reliability is that the list of things that fail often and the list of things that cost a lot are nearly opposite lists. Confusing them is why maintenance budgets are wrong.
Large monitoring programmes have tracked thousands of machines over many years, notably long-running German surveys of the 1990s and 2000s and European reliability studies of modern fleets. The pattern is consistent enough to state:
| Subsystem | Share of failures | Downtime per failure |
|---|---|---|
| Electrical system, converter, switchgear | 20 to 25% | hours to a day |
| Control system, sensors, software | 15 to 20% | hours |
| Pitch and hydraulics | 10 to 15% | a day or two |
| Yaw system | 5 to 8% | days |
| Gearbox | 5 to 8% | 250 to 350 hours |
| Generator | 4 to 6% | 150 to 250 hours |
| Blades | 5 to 7% | 200 to 400 hours |
| Main bearing and shaft | 2 to 4% | 200 to 300 hours |
Read the two right-hand columns against each other. The electrical and control systems produce nearly half of all faults and almost none of the lost production, because a tripped converter or a failed sensor is a technician, a laptop and an afternoon. The gearbox produces one fault in fifteen and dominates the cost, because a gearbox exchange on a 3 MW machine means a crawler crane, a road, a weather window and a component costing as much as a house.
A gearbox replacement on a machine of this class costs on the order of $250,000 to $500,000 all in, of which the crane mobilisation alone can be $50,000 to $150,000 depending on how bad the access track is. Multiply by the lost production over three hundred hours at 1.17 MW average and Chapter 16’s levelised cost calculation moves visibly.
IN PLAIN ENGLISH: Most of the things that go wrong with a wind turbine are electrical and take an afternoon to fix. Almost all of the money goes on three or four things that hardly ever go wrong and need a crane the size of a building when they do. Any maintenance plan built around the first list and not the second will be wrong.
Section 2: The Blade, Which Lightning Kills
Lightning is the commonest cause of blade damage, and the reason is not subtle: a turbine is a 155 m (509 ft) grounded conductor standing in an open field, and it is often the tallest thing for miles.
Strike rates vary enormously with geography. In much of northern Europe a turbine might be struck a fraction of a time per year on average; in high flash density regions of the tropics and in parts of Japan and the American Midwest, several times a year is normal. And tall structures do not merely intercept downward lightning, they initiate upward flashes of their own, which is a distinct phenomenon that scales strongly with height and which was not much studied until turbines got tall.
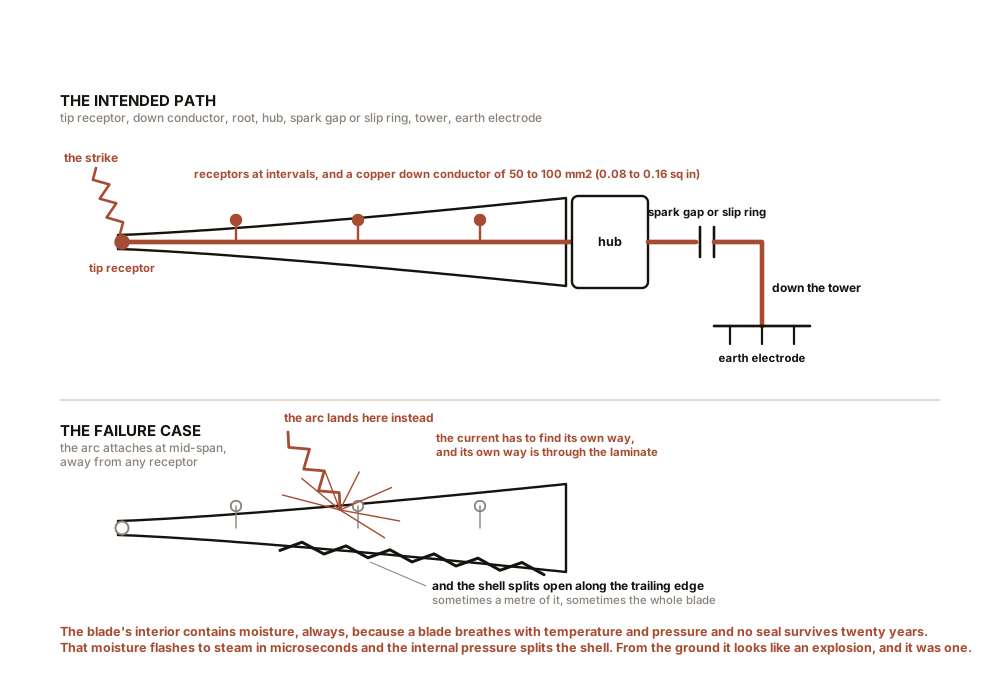
Chapter 11 described the protection: metal receptors at the tip and along the blade, a down conductor of 50 to 100 square millimetres (0.08 to 0.16 square inches) of copper inside, and a path from hub to tower to earth, all to the IEC 61400-24 standard. When it works, a 30 to 200 kA discharge passes through the blade and nothing much happens.
The failure case is when the arc attaches somewhere that is not a receptor. Then the current has to find its own way, and its own way is through the laminate. The blade’s interior contains moisture, always, because a blade breathes with temperature and pressure changes and no seal survives twenty years. That moisture flashes to steam in microseconds and the internal pressure splits the shell, sometimes along a metre of trailing edge and sometimes the whole blade. From the ground it looks like an explosion, and in an important sense it was one.
The second blade killer is slower and costs more energy in total: leading edge erosion.
Chapter 4 computed the relative wind at the tip as 79 m/s (177 mph). Rain, hail, sand and insects arrive at that speed, and they arrive continuously. Over years the gelcoat pits, then the laminate roughens, then material is lost, and the leading edge goes from a fair curve to a ragged one.
The aerodynamic consequence is exactly what Chapter 4 predicts. A roughened leading edge triggers early boundary layer transition and separation, so drag rises and the lift-to-drag ratio falls. Since Chapter 6 showed the drag loss is roughly the tip-speed ratio divided by the lift-to-drag ratio, halving L/D from 100 to 50 costs about seven percent of the power coefficient, and measured annual energy losses of 1 to 5 percent on eroded blades are well documented, with worse cases beyond that.
And it is cheap to prevent and expensive to ignore. Polyurethane protective tapes and elastomeric coatings on the outer third of the leading edge cost a fraction of a repair, and the industry’s move toward applying them at the factory rather than after the damage is one of the more sensible recent changes.
Section 3: Gearbox and Bearing, and an Honest Unknown
The gearbox is designed to a twenty-year life and frequently does not achieve it. Field experience across many fleets has seen median replacement well inside that, sometimes at six to twelve years, and in some early fleets essentially every gearbox was replaced within a decade.
Why, when gear design is a mature discipline with a century of practice behind it? Because the load spectrum is unlike anything else gears are asked to do.
One: the torque is enormous and the speed is low. Chapter 11 gave 2.3 MN·m at rated. Gear tooth contact stress goes with torque, and low speed means each tooth spends a long time under load with a thin oil film.
Two: the load reverses and fluctuates constantly. Chapter 9’s shear, tower shadow and turbulence deliver a load cycle at 1P and 3P forever, and a gust can double the torque in a second. Gears designed for a steady industrial drive are not designed for that.
Three: transient events are worse than steady loads. A grid fault, an emergency stop, or a converter trip removes the load torque in milliseconds. The gear teeth unload, the backlash opens, and then the load slams back on, and repeated impacts of that kind do damage that no steady-state calculation predicts.
Four: the bearings, and here is where the book has to admit an unknown. A specific failure mode called white etching cracking, or axial cracking, appears in gearbox bearings, particularly on the high-speed shaft, at a small fraction of the calculated rolling contact fatigue life. Subsurface cracks form with an altered microstructure that etches white under a microscope, and they propagate to the surface and spall.
The mechanism is genuinely contested and has been for twenty years. The main candidates are hydrogen embrittlement from lubricant decomposition at the contact, stray electrical current passing through the bearing from the converter and eroding the raceway, and transient slip when the rollers skid rather than roll under load reversals. It is likely that more than one is real and they interact.
What would settle it is instrumented bearings in service fleets measuring shaft voltage, film thickness and slip simultaneously through real transient events, over years, with post-mortem metallurgy. That work is being done and it is slow, because the failures take years to appear and the machines are in the way of the instruments. In the meantime the practical responses are all mitigations rather than cures: insulated bearings and shaft grounding brushes to remove the current path, different lubricant chemistries, and a shift toward direct drive to delete the component entirely, which is Chapter 11’s offshore argument arriving from a different direction.
Section 4: Ice, and the Runaway
Ice does three separate things and only the first is obvious.
It changes the blade’s shape, and a leading edge with a rime accretion on it has the aerodynamics of a leading edge with a rime accretion on it, which is to say poor. Power falls, sometimes by tens of percent, before anyone notices.
It changes the blade’s mass, unevenly, which is worse. Ice does not accrete equally on three blades, so the rotor becomes unbalanced, and an unbalanced rotor of 65 tonnes (143,000 lb) at 13.6 rpm applies a rotating force to the main bearing and the tower. Machines in cold climates detect this from the vibration signature, or from the power curve: a machine producing well below its expected output at a measured wind speed, with the temperature near 0 °C (32 °F), is iced, and the controller shuts it down.
And it comes off. Ice shedding from a moving blade is thrown, and the standard planning rule of thumb for a risk envelope is 1.5 times the sum of hub height and rotor diameter. For our machine that is 1.5 times 210 m (689 ft), which is 315 m (1,033 ft). That figure is why cold-climate sites carry warning signage, why access tracks are closed during icing events, and why setbacks in some jurisdictions are written around it rather than around noise.
Annual energy losses from icing at cold-climate sites run from 1 to 15 percent and occasionally beyond. Blade heating, either electrical elements in the laminate or hot air circulated inside, is available and it consumes 1 to 4 percent of production to save considerably more.
Then the failure that destroys the machine in under a minute: overspeed.
Here is the sequence. The grid disappears. A fault opens a breaker, and the electrical load torque on the rotor goes to zero instantly, in milliseconds, with the wind still blowing and the blades still at a fine pitch. The rotor is now a 65 tonne (143,000 lb) flywheel with a 3 MW engine attached and nothing to push against.
If the pitch system works, it feathers and the event is a non-event, which is exactly why Chapter 11’s accumulator or battery exists and why it is the most safety-critical item in the nacelle. If the pitch system does not work, the rotor accelerates.
And the loads go as the square of speed. Centrifugal force at a blade root is the blade’s mass times the angular velocity squared times the radius of its centre of mass. For our blade, 15 tonnes (33,000 lb) with its centre of mass about 20 m (66 ft) out, at rated speed that is about 610 kN, or 137,000 lbf. At twice rated speed it is four times that. At three times rated speed it is 5.5 MN, or 1.2 million lbf, and no blade root joint is built for it.
How long does it take? The rotor’s moment of inertia is of order 50 million kilogram metres squared, and the aerodynamic torque at rated is 2.3 MN·m, giving an angular acceleration of about 0.046 radians per second squared. Doubling the rotor speed therefore takes roughly half a minute.
And the only thing that saves it, when anything does, is Chapter 6. As the rotor accelerates past its optimal tip-speed ratio, its power coefficient collapses, so the driving torque falls and the acceleration slows. A rotor with its blades stuck at a fine pitch may find a runaway equilibrium at one and a half to two times rated speed and sit there, shaking, until somebody intervenes. Whether it survives is a race between the tip-speed ratio curve falling off and the centrifugal loads climbing, and the outcome depends on the pitch angle it got stuck at.
When it loses that race, the failure is spectacular and total: blades depart, the nacelle can be torn off, and the machine is scrap. Video of it exists and is not rare. It is the reason the pitch system’s emergency store is inspected on a schedule and tested, and the reason a stall-regulated machine has tip brakes that deploy on centrifugal force alone with no power and no decision.
Section 5: Birds and Bats, With the Numbers in Context
This is a real problem, it is smaller than its reputation, it is not nothing, and the mitigations are cheaper than the argument.
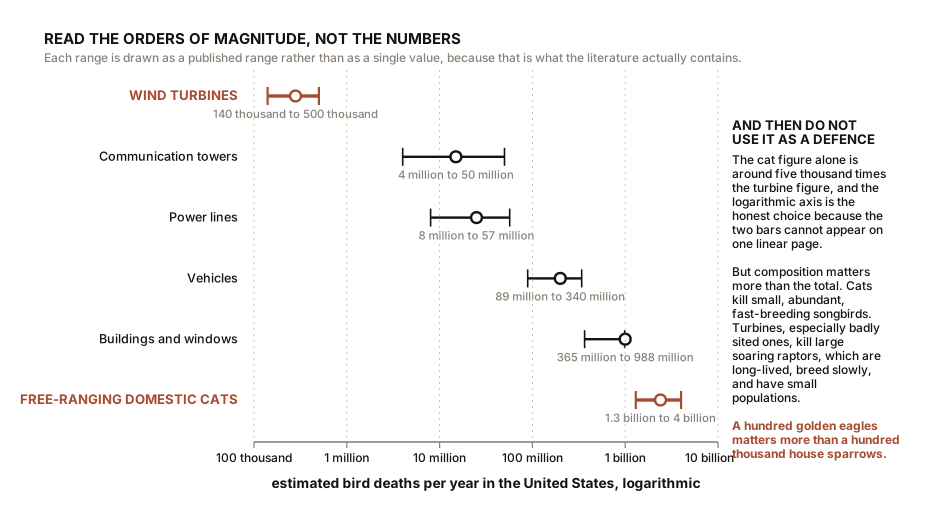
The estimates, and every one of them is an estimate. These figures come from carcass searches with statistical corrections for searcher efficiency and for scavengers removing bodies before anyone looks, extrapolated to national scale. None of them is a census and all of them have wide bounds, and anybody quoting them to a single significant figure is over-claiming.
For the United States:
| Cause | Estimated bird deaths per year |
|---|---|
| Wind turbines | 140,000 to 500,000 |
| Collisions with buildings and windows | roughly 1 billion, published range 365 million to 988 million |
| Free-ranging domestic cats | roughly 2.4 billion, published range 1.3 to 4.0 billion |
Read the orders of magnitude rather than the numbers. Turbines are in the hundreds of thousands. Windows are in the hundreds of millions. Cats are in the billions. The cat figure alone is around five thousand times the turbine figure.
That does not make the turbine figure acceptable and this book will not use it that way, for a reason that is ecological rather than arithmetical. The composition matters more than the total. Cats kill mostly small, abundant, fast-breeding songbirds. Turbines, especially badly sited ones, disproportionately kill large soaring raptors: eagles, kites, vultures. Those species are long-lived, breed slowly and have small populations, so a given number of deaths has a vastly larger population effect. A hundred golden eagles matters more than a hundred thousand house sparrows, and Chapter 3’s Altamont Pass, sited across a raptor flyway with thousands of small fast machines on lattice towers, is the case study.
And there is a mitigation that appears to work remarkably well. A study at Smøla in Norway painted one of the three blades black on four turbines and monitored collisions over several years, reporting a reduction on the order of 70 percent. The proposed mechanism is motion smear: a rotating blade at high tip speed becomes a transparent blur to a bird’s visual system, and breaking the rotational symmetry with a single contrasting blade restores something the bird can see.
Treat that result with the caution it deserves and take it seriously anyway. It is one site, four turbines, a small number of carcasses, and replication studies elsewhere were still in progress at the time of writing. A single-site result with a large effect size is exactly the kind of finding that often shrinks on replication. But painting a blade costs almost nothing, and if it delivers even a third of the reported effect it is the cheapest environmental intervention in the industry.
Bats are a different problem and arguably a larger one. Bat mortality at wind farms is concentrated in late summer and early autumn, at night, and at low wind speeds, which is counterintuitive until you realise that insects and therefore bats are active on calm nights.
Which hands the industry an unusually good deal. Because the mortality concentrates at low wind speeds, and because Chapter 10’s distribution says low wind speeds carry very little energy, raising the cut-in speed on late-summer nights, a practice called curtailment for bats, has been measured to reduce bat mortality by half or more at an annual energy cost typically under one percent. That is an exceptional ratio of benefit to cost and it is the clearest example in this book of a good measurement leading directly to a cheap fix.
ON THE BENCH: Measure a fatigue exponent with a paper clip
Chapter 9 claimed that fatigue damage rises as roughly the tenth power of stress range in a composite. That is an extraordinary sensitivity and it deserves testing, and the honest version of this experiment measures a different exponent for a different material, which is more instructive than confirming the one you were told.
Parts: twenty identical steel paper clips, or a coil of soft steel wire cut into equal lengths; a protractor printed on card; small pliers; a notebook. Optionally a strip cut from a plastic bottle and a strip of glass-fibre circuit board. Cost: nothing. Time: an hour, and it is a tedious hour, which is itself a lesson about fatigue testing. Hazards: wire ends are sharp and a fatigued wire snaps suddenly. Eye protection. Hold both ends.
Method: 1. Straighten a clip and mark a bending point. Bend it back and forth through 45 degrees each way, at a steady rate, counting cycles until it breaks. Repeat with five clips and take the median. 2. Now do five more clips at 90 degrees each way. Median again. 3. Compute the exponent: it is the logarithm of the ratio of the two cycle counts, divided by the logarithm of the ratio of the two angles.
What you should see: the 45-degree clips lasting roughly four to five times as many cycles as the 90-degree ones, which gives an exponent of about two.
Two, not ten. And that difference is the point of the box.
A paper clip bent through 45 degrees is deforming plastically, well past its yield point, which is the low-cycle fatigue regime, and in that regime the exponent for a ductile metal is around two. A turbine blade never yields; it flexes elastically, millions of times, in the high-cycle regime, and for a glass-fibre composite in that regime the exponent is around ten.
So the box has taught you a mechanism and a method, and explicitly not a number, which is the standing bargain of this whole series. What it does confirm, unambiguously, is the direction and the steepness: a modest increase in how far something is bent produces a large reduction in how long it lasts, and going from exponent two to exponent ten makes that relationship savage rather than merely unwelcome.
Better, if you have one: repeat with the plastic strip and the circuit board strip, at two amplitudes each, and compute an exponent for each material. You will get three different numbers, and the fact that the exponent is a material property rather than a universal constant is worth more than any single value of it.
ON THE BENCH: Find the ice by its vibration
Section 4 says a machine detects ice from its vibration signature. You can build that detector in twenty minutes with a phone.
Parts: your three-blade rotor and motor on a stand; a box fan; a smartphone with a free accelerometer or vibration recording application; tape; a lump of modelling clay or a few coins. Cost: nothing. Time: 30 minutes. Hazards: the fan, and a deliberately unbalanced rotor, which is the whole point of the exercise. Keep the added mass small, a few grams, and stand to one side. Do not spin a badly unbalanced rotor fast.
Method: 1. Tape the phone firmly to the rotor’s stand or mast, not to the rotor. 2. Run the rotor balanced and record the vibration for thirty seconds. Look at the spectrum if the application offers one. 3. Stop. Stick 2 g (0.07 oz) of clay near the tip of one blade. Run and record again. 4. Stop. Move the same clay to the tip of a second blade so two are loaded and one is not. Record again. 5. Stop. Put equal clay on all three. Record again.
What you should see: with one blade loaded, a strong peak at the rotational frequency, 1P, that was not there before. With two loaded, still a 1P peak, because two out of three is still asymmetric. With all three equally loaded, the 1P peak largely disappears even though the rotor is now much heavier and slower.
Which is the whole diagnostic. The controller is not looking for ice, it cannot see ice. It is looking for asymmetry, at 1P, and asymmetry is what dangerous icing produces. A rotor that iced up perfectly evenly would be undetectable by vibration and would have to be caught by the power curve instead, which is why real machines use both methods.
If it does not work: phone accelerometers are noisy at low frequency. Increase the rotor speed, increase the added mass slightly, or mount the phone on a springier part of the stand where the response is larger.
Section 6: The Failure That Is Not Mechanical
A turbine can be perfectly built, perfectly maintained, never break a single component, and still be a total financial loss. The mechanism is the cube law taking its revenge on an optimistic wind resource assessment, and historically it has destroyed more value than every gearbox failure combined.
The pattern, and it is documented. Through the 2000s a series of portfolio reviews found that operating wind farms were systematically producing less than their pre-construction P50 energy estimates, by something in the region of 5 to 10 percent on average across studied fleets. Not a few bad projects. A consistent central bias.
The causes were mundane and cumulative: shear extrapolation from a 50 m (164 ft) met mast to an 80 m (262 ft) hub using an assumed exponent rather than a measured one; wake losses within the array underestimated; availability assumed at a manufacturer’s figure rather than a fleet figure; blade soiling and icing not modelled; and, underneath all of it, a commercial incentive pointing in only one direction, since a project that does not clear its financing threshold does not get built and nobody is paid.
And now the arithmetic that makes a modest error catastrophic. Take our reference site and machine, and suppose the long-term mean wind speed is really 6.4 m/s (14.3 mph) rather than the assessed 7.0 m/s (15.7 mph). That is 8.6 percent low.
Integrate Chapter 13’s power curve against a Weibull distribution with that lower mean and the average output falls from 1,169 kW to 966 kW.
966 / 1,169 = 0.826An 8.6 percent error in wind speed costs 17.4 percent of the annual energy. Roughly twice the error, in a project financed on twenty-year debt with a margin considerably thinner than 17 percent.
Notice also that it is not the full cube. The cube law alone would predict a 24 percent loss. Chapter 13’s rated ceiling blunts it, because the machine was throwing away the top of the distribution anyway, so losing some of it costs less than proportionally. The power curve is a partial shock absorber for resource error, and that is the only good news in this section.
What the industry did about it is the model for how a discipline corrects itself, and it is worth knowing because it is what you should demand of any energy estimate. Loss and uncertainty factors are now itemised explicitly rather than bundled: wake, availability, electrical, curtailment, icing, soiling, each with its own number. Shear is measured with masts at multiple heights or with lidar rather than assumed. And results are reported as a distribution rather than a value, so a bank sees P50, P75 and P90, and lends against the P90.
SLOW DOWN. Check Your Understanding: A wind farm has been running for eight years. Its energy output has declined by about 1 percent per year, steadily, with no component failures and no change in the local wind climate. Availability has stayed above 97 percent throughout. What is happening, and what should the owner do about it? Think before reading on.
The blades are getting worse, and the fix is a lift and some tape.
Steady, gradual, fleet-wide decline with no failures and no availability loss is the signature of progressive aerodynamic degradation, and the two main contributors are Section 2’s leading edge erosion and the accumulation of surface soiling: insects, dust, salt and organic growth. Both roughen the blade, both raise drag, and Chapter 4’s lift-to-drag ratio falls.
Measured performance degradation rates of 0.5 to 1.5 percent per year are commonly reported for onshore fleets, and a substantial part of it is recoverable rather than permanent, which is the actionable half of the answer.
What the owner should do, in order:
First, confirm it is the blades and not the assessment. Compare measured output against the machine’s own warranted power curve at measured wind speeds, not against the original energy forecast. If the power curve has moved, it is the machine. If the power curve is intact and only the energy is down, the wind climate or the wake environment changed, possibly because somebody built a wind farm upwind.
Second, inspect the leading edges, by drone or rope access, on the outer third of the blade only, because Chapter 4 showed that is where the work is done.
Third, repair and protect rather than replace. Filling, refairing and taping a leading edge is a fraction of a percent of a blade’s cost and typically recovers most of the loss.
And the general lesson, which is the one worth keeping from this whole chapter. A failure that announces itself is cheap, because somebody attends to it. A converter trip stops the machine and generates an alarm and gets fixed the same week. The expensive failures are the quiet ones: a leading edge roughening over eight years, a bearing cracking below the surface, a resource estimate that was 9 percent optimistic. None of those set off an alarm, all of them are found only by somebody comparing a measurement against a prediction, and that comparison is the entire content of a maintenance discipline.
Chapter 18 closes the book by taking Chapter 1’s promise apart line by line and checking whether it was kept.

Bench Degree
Get the degree without the diploma.
Learn the material, not how to pass the exam.