Bench Degree·WIND POWERchapter
Chapter 9: The Wind Itself
The ground drags on the air, so the wind at 10 m (33 ft) is not the wind at 100 m (328 ft), and it is not as steady either. Tower height, turbine spacing and blade life are all arguments with that one fact.
Chapter 8 closed on a sentence worth repeating. Every rotor configuration in existence spans a factor of about three in power coefficient. A poor site against a good one spans a factor of eight or more. All the money is in the wind, and this chapter is about the wind.
Two facts organise it. Wind speed rises with height, which is why towers are tall and why the tower is often the project. And wind speed is a distribution rather than a number, which is why an average on its own tells you almost nothing when power goes as the cube.
Section 1: The Boundary Layer, and Why Height Buys Wind
Somewhere between 500 m and 2,000 m (1,600 ft and 6,600 ft) above the ground, depending on the weather, the air is moving at whatever speed the pressure gradient dictates and it neither knows nor cares that there is a planet underneath. Below that, it does. That layer where the ground’s friction still matters is the atmospheric boundary layer, and every wind turbine ever built lives inside it.
At the ground itself the air is stationary, because air sticks to surfaces. A short distance up it is moving a little. Higher still, more. The result is a velocity profile: wind speed increasing with height, steeply near the ground and then flattening out. That gradient is called wind shear, and it is the reason towers exist.
Two ways of writing it down, and you should know both because the industry uses both.
The power law, which is empirical, crude and universally used because it is easy:
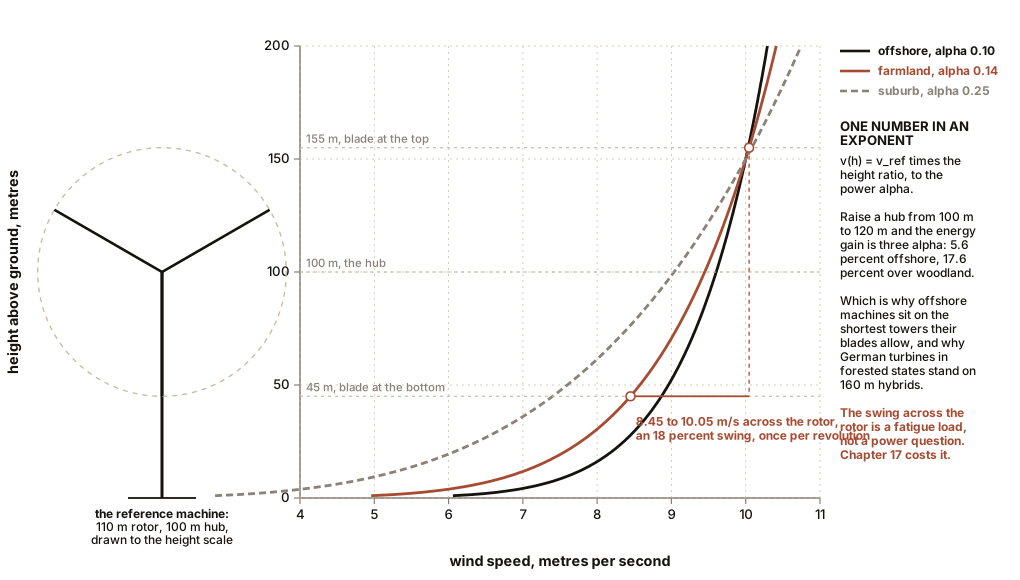
v(h) = v_ref × (h / h_ref)^αYou measure the wind at one height, and α, the shear exponent, lets you estimate it at another. Typical values:
| Terrain | α |
|---|---|
| Open water, offshore | 0.10 |
| Smooth open ground, short grass, mown field | 0.14 |
| Crops, scattered hedges | 0.20 |
| Suburbs, many trees, scattered buildings | 0.25 |
| Woodland, dense suburbs, city | 0.30 to 0.40 |
The value 0.14, one seventh, is the classic textbook figure and it applies only to open flat ground. Using one seventh over a suburb will underestimate the benefit of a tall tower by a large margin, and using 0.30 over a prairie will overestimate it.
The log law, which has a physical basis in boundary-layer theory and is more accurate near the ground:
v(h) = (u* / κ) × ln(h / z₀)Here κ is the von Kármán constant, about 0.4, u* is the
friction velocity, a measure of how hard the wind is scrubbing the
surface, and z₀ is the roughness length, a property of
the terrain with units of length. It is not the height of the obstacles;
it is roughly one tenth to one thirtieth of it.
| Surface | z₀ |
|---|---|
| Calm open sea | 0.0002 m (0.0008 in) |
| Snow, mudflats | 0.005 m (0.2 in) |
| Mown grass | 0.01 m (0.4 in) |
| Crops, farmland | 0.05 m (2 in) |
| Hedges, scattered trees | 0.3 m (12 in) |
| Suburbs | 0.5 to 1.5 m (20 to 59 in) |
| Woodland, city centre | 1 to 2 m (39 to 79 in) |
Section 2: Tower Height Economics, Done With Two Exponents
Here is the whole argument for tower height in one calculation, and it is a fight between two exponents.
Energy in the wind goes as the cube of speed, and speed goes as height to the power α. So
energy ∝ h^(3α)Tower cost goes roughly as the square of height, because a taller tower must be stronger to carry the same rotor thrust at a longer lever arm, and stiffer to keep its natural frequency clear of the rotor’s excitation.
So the exponent on the benefit is 3α and the exponent on the cost is about 2. The benefit exponent is always smaller than the cost exponent unless α exceeds two thirds, which never happens. Cost always wins eventually, and the question is only where.
Put numbers on it. Raise a hub from 100 m to 120 m (328 ft to 394 ft), a 20 percent increase:
| Terrain | α | 3α | Energy gain |
|---|---|---|---|
| Offshore | 0.10 | 0.30 | 5.6% |
| Open farmland | 0.14 | 0.42 | 7.9% |
| Crops and hedges | 0.20 | 0.60 | 11.7% |
| Suburb or woodland | 0.30 | 0.90 | 17.6% |
Against a tower cost that rose by something like 25 to 40 percent. Which is exactly why offshore machines sit on the shortest towers their blades allow, and why German turbines in forested inland states stand on 160 m (525 ft) concrete and steel hybrids. Same physics, opposite answers, and the whole difference is one number in an exponent.
And a third factor that decides more cases than either. Tubular steel tower sections are limited to about 4.3 m (14 ft) in base diameter, because that is what fits under motorway bridges. A tower’s stiffness depends strongly on its diameter, so above roughly 120 m (394 ft) a steel tube of legal width becomes too flexible and too heavy, and the answer is a concrete tower cast on site, a bolted lattice, or a steel tube assembled on site from curved plates. The tallest towers in the world exist because of a road transport limit, which is an unromantic but entirely real piece of engineering history.
IN PLAIN ENGLISH: Going higher always gets you more wind, and always gets you less wind per dollar than the last increase did. The exact height where you stop depends on how rough the ground is: over water, barely climb at all; over a forest, climb as high as you can afford. And past about the height of a forty-storey building, the deciding factor stops being physics and becomes whether the parts fit under a bridge.
Section 3: Turbulence, Which Destroys Machines Rather Than Slowing Them
The mean wind speed is an average of a quantity that is jumping about constantly. The measure of the jumping is turbulence intensity:
TI = σ / v̄the standard deviation of wind speed divided by the mean, conventionally over a ten-minute window. Typical values:
| Location | TI |
|---|---|
| Offshore | 6 to 8% |
| Flat open land | 10 to 14% |
| Rolling terrain, some trees | 15 to 20% |
| Complex terrain, forest edge | 20 to 30% |
| Behind or beside a building | 30 to 50% |
The international design standard for wind turbines, IEC 61400-1, classifies machines by both mean wind speed and turbulence, with reference turbulence intensities of 16 percent for the roughest class, 14 percent for the middle and 12 percent for the gentlest. A machine certified for one class and installed at a site in a rougher class is not slightly overloaded, it is out of certification, and Chapter 17 is about what follows.
Now the sentence this section exists for. Turbulence costs you a few percent of energy and it can cost you the entire machine, and the reason is fatigue.
Fatigue damage does not accumulate in proportion to load. For a material’s stress-life curve with exponent m, the damage done by a load cycle goes as the stress range raised to the power m. For steel, m is around 3 to 5. For glass-fibre composite, which is what blades are made of, m is around 10.
Read that again with a number in it. Doubling the alternating stress range in a composite blade multiplies the fatigue damage by two to the tenth, which is a factor of about a thousand. A ten percent increase in stress range multiplies damage by 1.1 to the tenth, which is 2.6, so a ten percent load increase costs well over half the blade’s life.
That is why turbulence is a structural question and not a performance question. A turbulent site does not gently reduce your output. It quietly consumes your design life at several times the intended rate, and the bill arrives in year eight rather than year twenty.
Three sources of cyclic load, all of them unavoidable and all of them once or three times per revolution:
Wind shear across the rotor. Section 1’s profile means the blade at the top of its circle is in faster air than the blade at the bottom. For our 110 m (361 ft) rotor at 100 m (328 ft) hub height on farmland with α of 0.14, the top of the rotor at 155 m (509 ft) sees about 6.4 percent more wind than the hub and the bottom at 45 m (148 ft) sees about 11 percent less. That is an 18 percent swing in the wind arriving across the rotor, and therefore a swing of roughly the same order in each blade angle of attack and in its lift, once per revolution, forever.
Tower shadow. Even on an upwind machine, the tower is an obstacle and the air slows slightly as it approaches. Each blade passes through that slower patch once per revolution. On a downwind machine the effect is far worse, which is one of the several reasons downwind machines are rare.
Yaw misalignment. The rotor is never exactly square to the wind, and when it is off by a few degrees each blade sees a cyclically varying inflow.
ON THE BENCH: Map the turbulence around your own house
This is the measurement that decides Chapter 15, and it takes one windy afternoon.
Parts: a hand anemometer with a maximum-and-average function, $25 to $40; a broom handle or a 2 m (6.5 ft) length of conduit to hold it away from your body; a notebook; a windy day with a steady direction. Cost: the anemometer. Time: two hours. Hazards: none, beyond not climbing anything. Do not do this on a roof. The whole point of the exercise is that you do not need to.
Method: pick six stations and hold the anemometer at each for two full minutes, at the same height, roughly 2 m (6.5 ft), noting the average and the highest gust: 1. In the open, as far from the house as your ground allows. 2. On the windward side, about one house-height away from the wall. 3. Tight against the windward wall. 4. On the leeward side, one house-height from the wall. 5. At the corner of the house, where the flow separates. 6. Downwind of a hedge or a line of trees, if you have one.
For each station compute a rough turbulence intensity: take the gust, subtract the average, divide by the average. It is not the formal ten-minute definition of Section 3 but it ranks the stations correctly, which is all you need.
What you should see, and it is startling the first time:
Station 1 has the highest average and the lowest ratio. Open air is both faster and steadier. Station 4, in the lee, may show half the average speed of station 1, and by the cube law that is one eighth of the power. Station 5, at the corner, often shows a higher gust than station 1 while having a lower average, because separated flow at a building corner accelerates and then breaks up, so it is both slower on average and more violent.
Then cube your averages. Divide each station’s average cubed by station 1’s average cubed. That column of numbers is the fraction of the available energy each location would give you, and the numbers near the house will be shockingly small.
If it does not work: on a light or shifty day nothing will separate cleanly. Wait for a day with a steady direction and a real breeze, above about 5 m/s (11 mph) in the open. It is worth waiting for.
Better, if you have one: repeat with the anemometer on the broom handle held as high as you can reach at station 1, and at ground level at the same spot. The ratio between the two, over that small height difference, lets you estimate your own shear exponent. Then extrapolate to 30 m (100 ft) and see what a real tower would be worth, which is the number Chapter 15 will ask you for.
Section 4: Wakes, and Why Turbines Stand So Far Apart
Chapter 5 proved that an ideal rotor slows the air to one third of its upstream speed far downstream, and expands its wake to twice the rotor area. That wake is a real object and it lasts a long way.
Behind a working turbine there are two things: a velocity deficit, the air is slower, and added turbulence, from the shed blade-tip vortices breaking down. Both recover as the wake mixes with the surrounding air, and both take several rotor diameters to do it.
Typical measured recovery for a single machine on flat ground:
| Distance downwind | Velocity deficit on the axis |
|---|---|
| 2 diameters | 30 to 40% |
| 5 diameters | 15 to 25% |
| 7 diameters | 10 to 18% |
| 10 diameters | 5 to 10% |
| 15 diameters | under 5% |
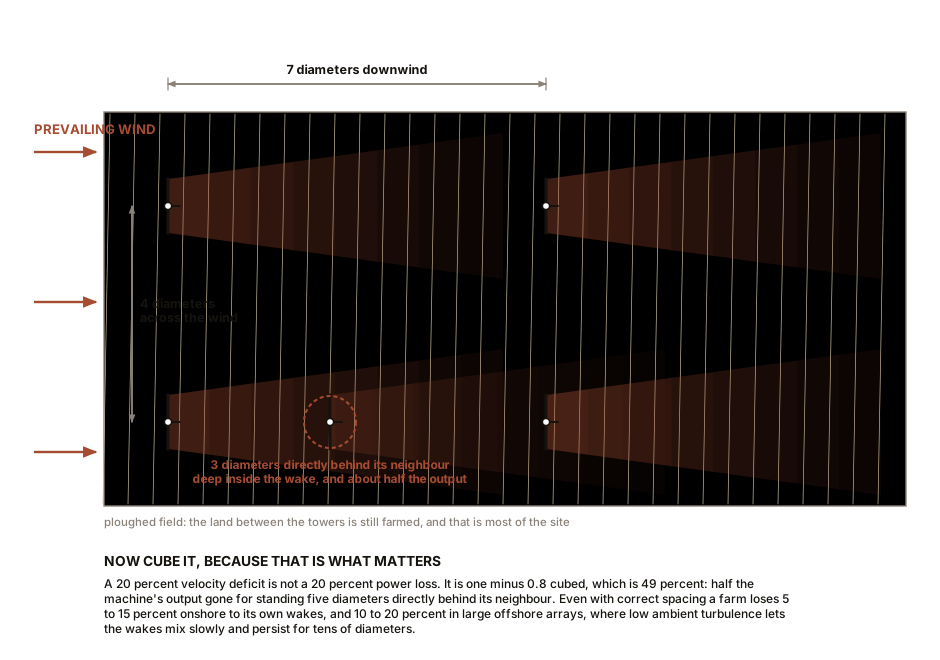
Now cube it, because that is what matters. A 20
percent velocity deficit is not a 20 percent power loss. It is
1 − 0.8³, which is 49 percent. Half the
machine’s output, gone, for standing five diameters directly behind its
neighbour.
Which is why turbines in a farm are spaced the way they are: typically 5 to 9 rotor diameters apart along the prevailing wind direction and 3 to 5 diameters across it. For our 110 m (361 ft) rotor that is 550 to 990 m (1,800 to 3,250 ft) downwind and 330 to 550 m (1,080 to 1,800 ft) crosswind, which is why a wind farm occupies so much land while using almost none of it: the ground between the towers is still farmed.
Even with correct spacing, a farm loses energy to its own wakes. Array losses of 5 to 15 percent are normal onshore, and 10 to 20 percent in large offshore arrays, where the low ambient turbulence means wakes mix slowly and persist for tens of diameters. Offshore wakes have been photographed condensing into visible cloud streets in the right humidity, which is Chapter 5’s stream tube made spectacularly visible.
And a wake is a fatigue source as well as an energy loss. A downstream machine runs in air with elevated turbulence intensity, so Section 3’s tenth-power rule applies to it and not to its upwind neighbour. Machines in the interior of a large farm fail sooner than the ones on the edge, and the certification standard has a specific provision for calculating the effective turbulence a machine sees from all its neighbours.
That is the wind treated as a shape: a profile that climbs with height, a roughness that sets how fast it climbs, a turbulence that eats blades, and a wake that lasts for kilometres. What none of it gives you yet is a number you can multiply by anything, because the wind at a site is a spread of speeds rather than a speed. That is the second of this chapter’s two organising facts, and it is the whole of Chapter 10.

Bench Degree
Get the degree without the diploma.
Learn the material, not how to pass the exam.